OPEN-SOURCE SCRIPT
Volatility Based Momentum (VBM)
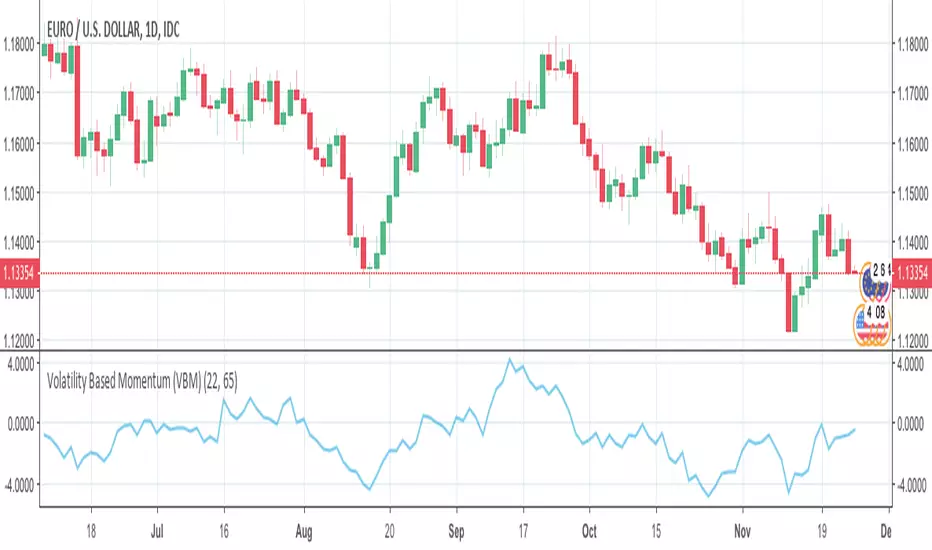
The Volatility Based Momentum (VBM) indicator is a variation on the rate-of-change (ROC) indicator. Instead of expressing momentum in a percentage gain or loss, VBM normalizes momentum using the historical volatility of the underlying security.
The VBM indicator offers numerous benefits to traders who orient their trading around volatility. For these traders, VBM expresses momentum in a normalized, universally applicable ‘multiples of volatility’ (MoV) unit. Given the universal applicability of MoV, VBM is especially suited to traders whose trading incorporates numerous timeframes, different types of securities (e.g., stocks, Forex pairs), or the frequent comparison of momentum between multiple securities.
The calculation for a volatility based momentum (VBM) indicator is very similar to ROC, but divides by the security’s historical volatility instead. The average true range indicator (ATR) is used to compute historical volatility.
VBM(n,v) = (Close - Close n periods ago) / ATR(v periods)
For example, on a daily chart, VBM(22,65) calculates how many MoV price has increased or decreased over the last 22 trading days (approximately one calendar month). The second parameter is the number of periods to use with the ATR indicator to normalize the momentum in terms of volatility.
For more details, there is an article further describing VBM and its applicability versus ROC.
Script de código abierto
Fiel al espíritu de TradingView, el creador de este script lo ha convertido en código abierto, para que los traders puedan revisar y verificar su funcionalidad. ¡Enhorabuena al autor! Aunque puede utilizarlo de forma gratuita, recuerde que la republicación del código está sujeta a nuestras Normas internas.
Exención de responsabilidad
La información y las publicaciones no constituyen, ni deben considerarse como asesoramiento o recomendaciones financieras, de inversión, de trading o de otro tipo proporcionadas o respaldadas por TradingView. Más información en Condiciones de uso.