PROTECTED SOURCE SCRIPT
Adaptive Average True Range
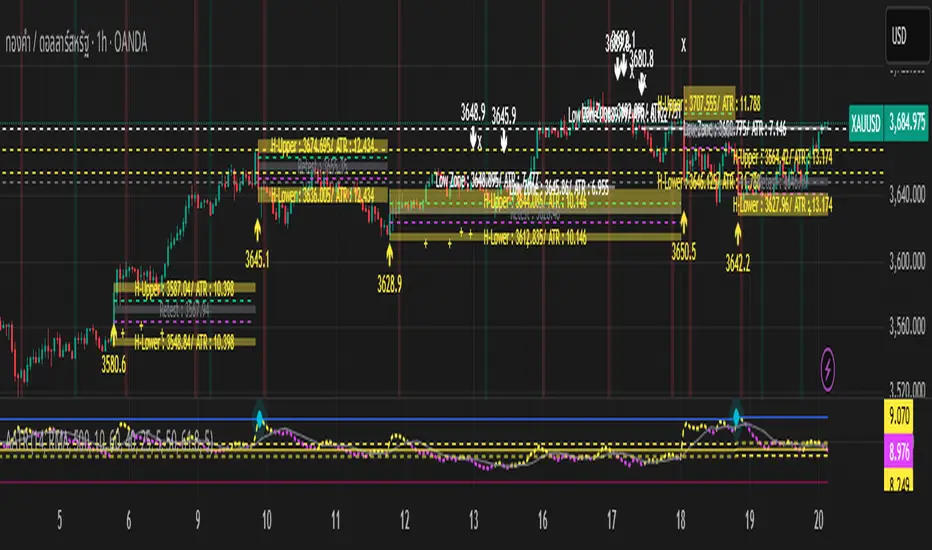
The retest of the candlestick can be categorized into two patterns: a strong trend or a sideways market.
In the case of a strong trend, whether it is a downtrend or an uptrend, the retest often only reaches the box drawn on the wicks. However, sometimes it may only retest the 0.382 level for a downtrend or the 0.732 level for an uptrend. Infrequently, if the asset has sufficient volatility, the price may retest the box on the opposite side of the trend.
In the case of a market entering a sideways phase, whether it's a sideways down or sideways up, the price will typically retest the central box before determining its next direction.
This indicator also measures the standard deviation of the ATR to determine the maximum and minimum price movement, based on another hypothesis regarding "time for a move or time for a slow down," which is plotted as a background color.
Please use this indicator with caution, as it is based solely on a hypothesis.
Script protegido
Este script se publica como código cerrado. No obstante, puede utilizarlo libremente y sin ninguna limitación. Obtenga más información aquí.
Exención de responsabilidad
La información y las publicaciones no constituyen, ni deben considerarse como asesoramiento o recomendaciones financieras, de inversión, de trading o de otro tipo proporcionadas o respaldadas por TradingView. Más información en Condiciones de uso.