PROTECTED SOURCE SCRIPT
NOFOMO INDICATOR

NOFOMO Indicator
ABOUT:
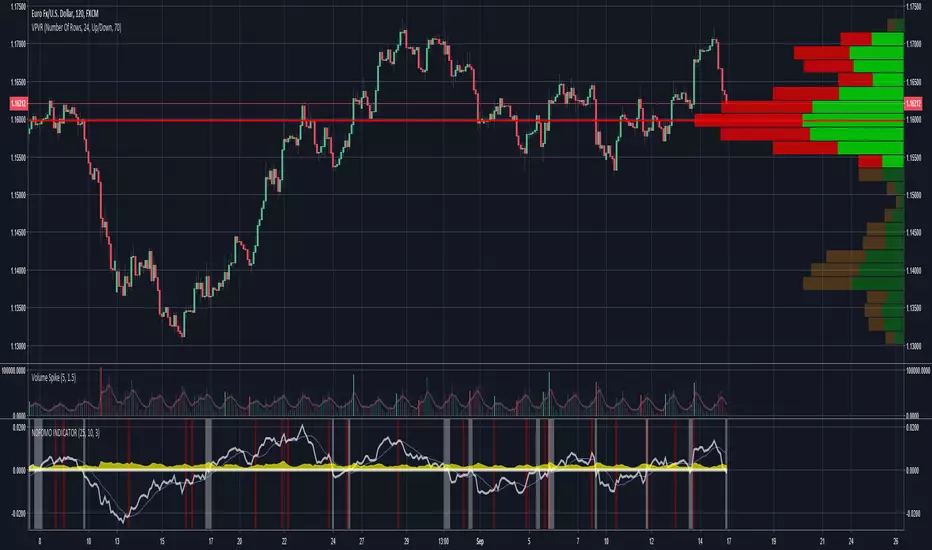
This indicator can be used in conjunction with alerts to detect shifts in Momentum, which usually occur before volatility. ATR (Average True Range) is included as a measurement of volatility.
Momentum(White Line)
Zero Line(White Line)
Momentum SMA(Blue Line)
Average True Range(Yellow Area)
Momentum Crossover Momentum SMA(Red Highlight)
Momentum Cross Zero Line(White Highlight)
BASIC USE FOR TRADING:
Suggested Time-Frame: 30m, 1h, 2h, 4h
When Momentum crosses the “0” line this indicates a strong change in price action. You can observe price begin or continue to go UP after Momentum crosses the “0” line from the downside, moving upward. Likewise for downward movement as well. If you observe Momentum cross the “0” line from the upside moving downward, you will observe price begin or continue to move downward.
Prior to Momentum crossing the “0” line we can observe Momentum crossing over a light blue line, the SMA. Momentum crossing over the SMA indicates the initial change in price action and in some cases, can be used to verify or signal entry. One could theoretically use the Momentum/SMA cross as an alert, the Momentum crossing the “0” line as entry. One could also theoretically use a volume spike as an alert and the Momentum/SMA cross for entry. The point is that this indicators can be used in confluence with other indicators, and it can be used in various ways.
The most effective way to use either of the crosses (MOM/SMA or MOM/0 line) is to verify them against analyzing volume. Lets say you are using the MOM/SMA cross as an alert, and the momentum crossing “0” line as your entry signal. Once alerted, you will observe that Momentum has crossed the SMA and is heading toward the “0” line. Studying the price action and the volume bars, you can determine if the current price action has enough “fuel” to push momentum through the “0” line and begin its new trend.
The easiest way to analyze the volume for validity is to look for ascending volume bars that “grow” in proportion to price. For example a long candle stick should be associated with a tall volume bar, and a small candle stick should be associated with a short volume bar. This is not always the case though and further studies in to volume price analysis will be required on your end if you wish to use this indicator effectively with volume.
Authors: Sheldon#7775 & Walshdil#8568 (Discord)
Script protegido
Este script se publica como código cerrado. No obstante, puede utilizarlo libremente y sin ninguna limitación. Obtenga más información aquí.
Exención de responsabilidad
La información y las publicaciones no constituyen, ni deben considerarse como asesoramiento o recomendaciones financieras, de inversión, de trading o de otro tipo proporcionadas o respaldadas por TradingView. Más información en Condiciones de uso.