PROTECTED SOURCE SCRIPT
Actualizado Ichimoku signals by Jean-Philippe COQ
INDICATORS:
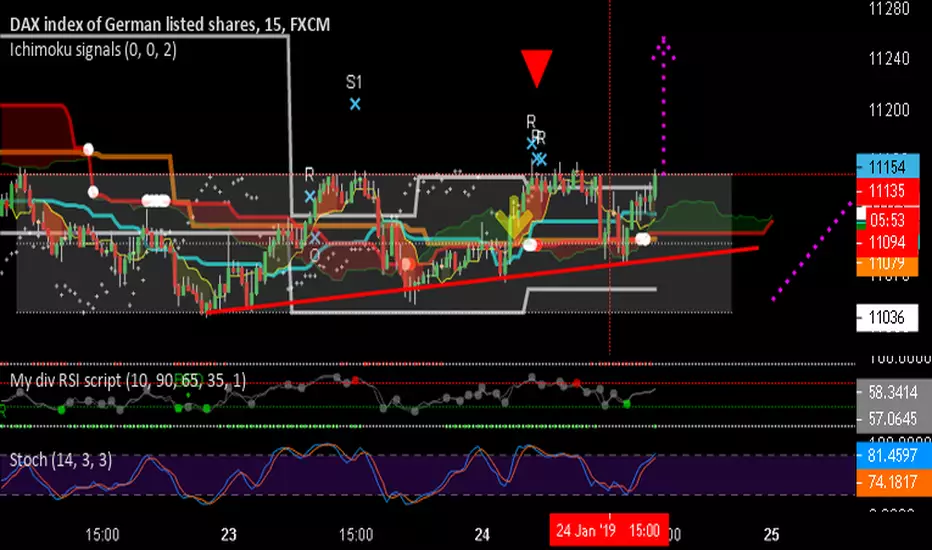
Show Yellow zone when oversold/overbought
Show splits : white when to come, yellow when occurs, red when flat with ssb, blue when flat with ssb and kj
Show probable range when appears in white lines
Show last higher highs lower lows in orange lines
Show probable next Kj values in thin aqua lines
checkChikou = blue diamond on price when close to chikou in TF or upper one
checkVol = show "V" when volume is higher than last 9 periods avg
checkRot = show "Z" when potential partial rotation in range is at work
checkHaram = take Harami pattern into account
SIGNALS (when ichimoku meet candle patterns)
L/H = rebound signals on higher highs / Lower Lows
C = potential rebound on overbought oversold zone
R = rebound signal on range edges
P = pullback rebound after break out of probable range
K = rebound on Kj in a trend (out of range)
Notas de prensa
INDICATORS:Show Yellow zone between price and tenkan when oversold/overbought
Show splits : white when to come, yellow when occurs, red when occurs with a flat Senkou Span B, blue when occurs with a flat Senkou Span B and kijun
Show probable range in white lines
Show last higher highs & lower lows in orange lines
SIGNALS (when ichimoku meet candle patterns)
L/H = rebound signals on higher highs / Lower Lows, target can be lower kj flat
C = potential rebound on overbought oversold zone, target can be lower kj flat
R = rebound signal on range edges, target can be last split
B = pullback/throwback rebound after break out of probable range, target can be last higher high (lower low)
K = rebound on Kj in a trend (out of range), target can be last higher high (lower low)
OTHER PARAMETERS
checkHaram = take Harami pattern into account
CheckallCandle = include all candle patterns
checkVol = show "V" when volume is higher than last 9 periods average
showFuture = next kijun/ssa/ssb values in thin lines
closeToChikou = the greater the value close to ichimoku lines is the test
showChikou = red cross on price when close to chikou in TF or upper one
Flatlen = bars of same value to validate an ichimoku flat
CheckSignal1 = check and show upper TF signals => manual check because not perfect, to unset when study error message !!
ShowEntry = green buy signal (red sell) when buy signal and chikou free and ratio >=2
Notas de prensa
workaround : remove signal UT1 to fix loop study issuesNotas de prensa
add partial rotation signalfix some bugs...
Notas de prensa
signal greater range signals with highest on longer periodNotas de prensa
fixNotas de prensa
fix ichimoku levels to see moreNotas de prensa
remove unrelevant signalsNotas de prensa
fix some bugsNotas de prensa
minor bug fix and speedNotas de prensa
show targets when availableNotas de prensa
fix some target bugNotas de prensa
improve range edgesNotas de prensa
Remove some consuming loopsNotas de prensa
fix levelsNotas de prensa
add alert lineNotas de prensa
Take into account possible range within possible rangeScript protegido
Este script se publica como código cerrado. No obstante, puede utilizarlo libremente y sin ninguna limitación. Obtenga más información aquí.
Exención de responsabilidad
La información y las publicaciones no constituyen, ni deben considerarse como asesoramiento o recomendaciones financieras, de inversión, de trading o de otro tipo proporcionadas o respaldadas por TradingView. Más información en Condiciones de uso.
Script protegido
Este script se publica como código cerrado. No obstante, puede utilizarlo libremente y sin ninguna limitación. Obtenga más información aquí.
Exención de responsabilidad
La información y las publicaciones no constituyen, ni deben considerarse como asesoramiento o recomendaciones financieras, de inversión, de trading o de otro tipo proporcionadas o respaldadas por TradingView. Más información en Condiciones de uso.