PROTECTED SOURCE SCRIPT
Deep in the Tape VSA
Deep in the Tape VSA
Overview
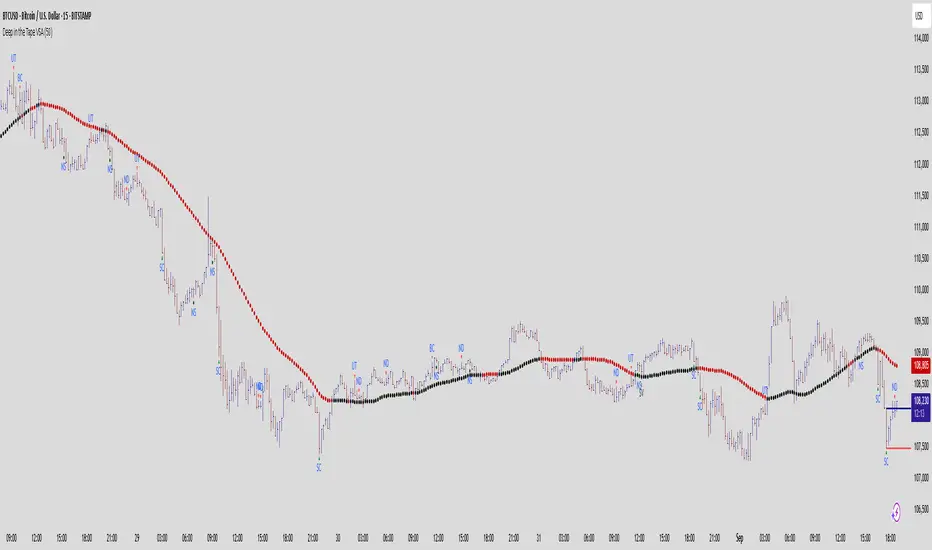
This study applies the principles of Volume Spread Analysis (VSA) as taught by Tom Williams. The purpose is not to generate signals, but to highlight the footprints of professional activity so that discretionary traders can read the market background, context, and likely response. It combines classic VSA events, contextual support/resistance lines, cluster zones, and an optional moving average—but each element is tied directly to VSA logic, not added arbitrarily.
Quick Start
This is a study-only VSA tool based on Tom Williams’ Volume Spread Analysis. It highlights professional activity through classic VSA events, projected support/resistance levels, and optional cluster/MA context. It does not provide alerts, trade entries, or failures—its purpose is to help traders visually study supply and demand in the background, just as Tom taught.
What It Shows
VSA Events
The tool identifies major supply/demand events that Tom Williams emphasized:
• Stopping Volume (SV)
• Selling Climax (SC)
• Shakeout (SO)
• Buying Climax (BC)
• Upthrust (UT)
• Supply Coming In
• No Demand (ND)
• No Supply (NS)
• Test Bar
• End of Rising Market (EoRM)
These are not buy/sell signals. They are points of interest where professionals are most active.
Context Lines
When a new ultra-high-volume VSA event occurs, the high and low of that bar are projected forward as horizontal lines. These levels often act as support/resistance where the market later reveals professional intent.
Cluster Zones (optional)
Clusters are built when several consecutive high-volume bars form a range. Depending on whether price absorbs at the lows or rejects at the highs, the zone takes on a bullish or bearish bias. This reflects Tom’s teaching that accumulation and distribution campaigns often occur in ranges.
Moving Average (optional)
A simple, color-shifting MA is included for context only. It’s not a trading signal. It helps frame whether the market is generally pushing above or below a key mean, complementing the VSA background.
How to Use It
Start with the Background
Look for ultra-high-volume events such as SC, SV, SO (strength) or UT, BC, Supply Coming In (weakness). These form the background. Do not trade them immediately—wait to see how price reacts.
Watch the Response at Levels
When price revisits the projected high/low of a trigger bar, ask:
• If the background is strong, do you see No Supply or a Test (low volume, narrow spread, firm close) near support?
• If the background is weak, do you see No Demand or poor rallies near resistance?
This response tells you whether professional money is defending or abandoning the level.
Study Clusters for Campaigns
If a high-volume cluster forms, treat it as potential accumulation/distribution. Price breaking away with supporting VSA context reveals the likely direction of the campaign.
Use the MA Only for Context
A Test or No Supply above the MA carries more weight. A No Demand or Upthrust below the MA is more reliable. The MA is not a signal—it is a gate that filters the background story.
Important Notes
This is a study-only tool. It does not provide alerts, entries, failures, or automated trading signals.
All events are contextual: they can repaint until the bar closes, and their value depends on background + response.
Volume behavior differs by symbol and market, so interpretation requires discretion.
The purpose is educational—to help traders apply Tom Williams’ VSA framework directly on charts.
Why this is not a mashup:
Every component (VSA events, projected lines, clusters, MA) is directly connected to VSA logic.
The script is not a rehash of built-ins. It encodes specialized conditions (spreads, closes, wick sizes, volume relative to background) to surface professional activity.
The description explains how each part is used together in Tom’s framework—making it clear, original, and useful to the community.
Disclaimer
This script is for educational purposes only and does not constitute financial advice.
Overview
This study applies the principles of Volume Spread Analysis (VSA) as taught by Tom Williams. The purpose is not to generate signals, but to highlight the footprints of professional activity so that discretionary traders can read the market background, context, and likely response. It combines classic VSA events, contextual support/resistance lines, cluster zones, and an optional moving average—but each element is tied directly to VSA logic, not added arbitrarily.
Quick Start
This is a study-only VSA tool based on Tom Williams’ Volume Spread Analysis. It highlights professional activity through classic VSA events, projected support/resistance levels, and optional cluster/MA context. It does not provide alerts, trade entries, or failures—its purpose is to help traders visually study supply and demand in the background, just as Tom taught.
What It Shows
VSA Events
The tool identifies major supply/demand events that Tom Williams emphasized:
• Stopping Volume (SV)
• Selling Climax (SC)
• Shakeout (SO)
• Buying Climax (BC)
• Upthrust (UT)
• Supply Coming In
• No Demand (ND)
• No Supply (NS)
• Test Bar
• End of Rising Market (EoRM)
These are not buy/sell signals. They are points of interest where professionals are most active.
Context Lines
When a new ultra-high-volume VSA event occurs, the high and low of that bar are projected forward as horizontal lines. These levels often act as support/resistance where the market later reveals professional intent.
Cluster Zones (optional)
Clusters are built when several consecutive high-volume bars form a range. Depending on whether price absorbs at the lows or rejects at the highs, the zone takes on a bullish or bearish bias. This reflects Tom’s teaching that accumulation and distribution campaigns often occur in ranges.
Moving Average (optional)
A simple, color-shifting MA is included for context only. It’s not a trading signal. It helps frame whether the market is generally pushing above or below a key mean, complementing the VSA background.
How to Use It
Start with the Background
Look for ultra-high-volume events such as SC, SV, SO (strength) or UT, BC, Supply Coming In (weakness). These form the background. Do not trade them immediately—wait to see how price reacts.
Watch the Response at Levels
When price revisits the projected high/low of a trigger bar, ask:
• If the background is strong, do you see No Supply or a Test (low volume, narrow spread, firm close) near support?
• If the background is weak, do you see No Demand or poor rallies near resistance?
This response tells you whether professional money is defending or abandoning the level.
Study Clusters for Campaigns
If a high-volume cluster forms, treat it as potential accumulation/distribution. Price breaking away with supporting VSA context reveals the likely direction of the campaign.
Use the MA Only for Context
A Test or No Supply above the MA carries more weight. A No Demand or Upthrust below the MA is more reliable. The MA is not a signal—it is a gate that filters the background story.
Important Notes
This is a study-only tool. It does not provide alerts, entries, failures, or automated trading signals.
All events are contextual: they can repaint until the bar closes, and their value depends on background + response.
Volume behavior differs by symbol and market, so interpretation requires discretion.
The purpose is educational—to help traders apply Tom Williams’ VSA framework directly on charts.
Why this is not a mashup:
Every component (VSA events, projected lines, clusters, MA) is directly connected to VSA logic.
The script is not a rehash of built-ins. It encodes specialized conditions (spreads, closes, wick sizes, volume relative to background) to surface professional activity.
The description explains how each part is used together in Tom’s framework—making it clear, original, and useful to the community.
Disclaimer
This script is for educational purposes only and does not constitute financial advice.
Script protegido
Este script se publica como código cerrado. Sin embargo, puede utilizarlo libremente y sin limitaciones: obtenga más información aquí.
Exención de responsabilidad
La información y las publicaciones que ofrecemos, no implican ni constituyen un asesoramiento financiero, ni de inversión, trading o cualquier otro tipo de consejo o recomendación emitida o respaldada por TradingView. Puede obtener información adicional en las Condiciones de uso.