PROTECTED SOURCE SCRIPT
RSI Big Data Query | assetsandcoffee
=============================================
…………………………..📖Description📚………………..……….
=============================================
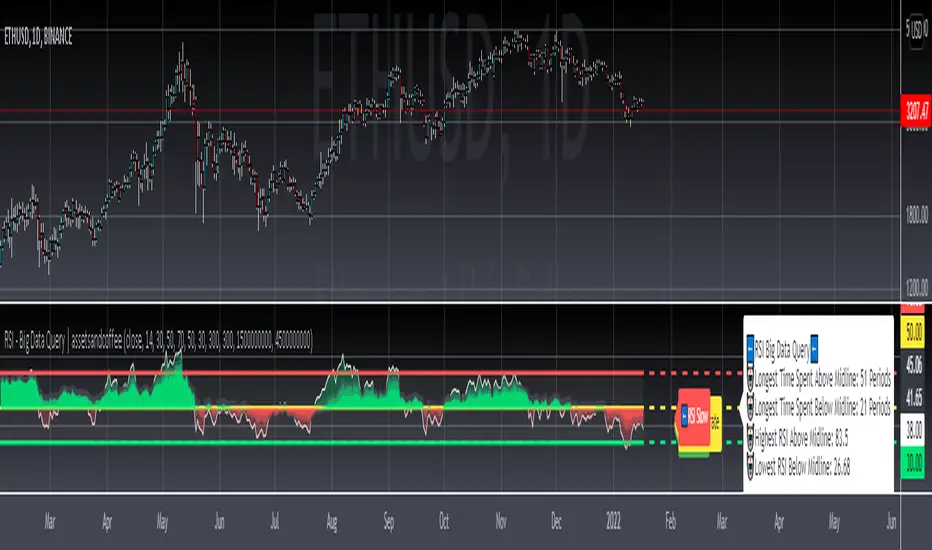
The Relative Strength Index(RSI) is a powerful momentum indicator used to determine when price is overbought or oversold. Fairly straight forward indicator that several new and veteran traders implement into their trading strategies.
What my implementation of the RSI aims to answer is "how do we get the most out of it?". The data is there, a programming language is provided to you, might as well combine those two to query useful information.
Enjoy!
=============================================
………………………...⚙️RSI Settings⚙️………………...………
=============================================
➡️Group : RSI Restriction Settings
1.) Indicators work well for specific timeframes. That being said, you have the option to activate the restriction for the indicator to work only the daily or 4 day, or on all time frames.
➡️Group : RSI Regular Settings
1.) RSI fast, moderate and slow lengths allow you to see the strength of each RSI given a particular amount of data.
- The more data that is taken in, the slower a line will move up or down for the RSI. That is how those mountains, hills, icebergs, however way you want to see the RSI data, were visually made possible.
- The strength of this visual implementation is shown, when we visit a resistance or support line more than once.
2.) RSI upper, middle, and lower thresholds were selected based on traditional specifications.
3.) Adjust RSI Labels allows the movement of the RSI fast, moderate, and slow labels left or right based on user preference.
➡️Group : RSI Big Data Query Settings
1.) Lookback Period For Longest Time Spent Above & Below Midline?
- The higher the lookback period, the more accurate your entry and exits may be, when attempting to time when a ticker will cross above or below the midline.
- If "NaN" shows as a result, it means the lookback period is set too high. The ticker has not been around long enough on the requested timeframe to produce a result.
2.) Lookback Period For Highest & Lowest RSI; Above and Below Midline?
- Attempting to sell the top or buy the dip? Exiting and entering as close to the peaks and troughs is a good place to start.
3.) Adjust Big Data Query Label allows the movement of the RSI big data query label left or right based on user preference.
=================================
....🎉🎉🎉Before You Go🎉🎉🎉…..
=================================
Leave a like👍 and/or comment💬.
We appreciate and value everyone's feedback.
Fancy the content? Make sure to follow us🌟 so you don't miss out on our new releases🔥
"Keeping it short and sweet as always"
- assetsandcoffee📈☕
=================================
..📚Indicator Legacy/Definition(s)📖..
=================================
investopedia.com/terms/r/rsi.asp
…………………………..📖Description📚………………..……….
=============================================
The Relative Strength Index(RSI) is a powerful momentum indicator used to determine when price is overbought or oversold. Fairly straight forward indicator that several new and veteran traders implement into their trading strategies.
What my implementation of the RSI aims to answer is "how do we get the most out of it?". The data is there, a programming language is provided to you, might as well combine those two to query useful information.
Enjoy!
=============================================
………………………...⚙️RSI Settings⚙️………………...………
=============================================
➡️Group : RSI Restriction Settings
1.) Indicators work well for specific timeframes. That being said, you have the option to activate the restriction for the indicator to work only the daily or 4 day, or on all time frames.
➡️Group : RSI Regular Settings
1.) RSI fast, moderate and slow lengths allow you to see the strength of each RSI given a particular amount of data.
- The more data that is taken in, the slower a line will move up or down for the RSI. That is how those mountains, hills, icebergs, however way you want to see the RSI data, were visually made possible.
- The strength of this visual implementation is shown, when we visit a resistance or support line more than once.
2.) RSI upper, middle, and lower thresholds were selected based on traditional specifications.
3.) Adjust RSI Labels allows the movement of the RSI fast, moderate, and slow labels left or right based on user preference.
➡️Group : RSI Big Data Query Settings
1.) Lookback Period For Longest Time Spent Above & Below Midline?
- The higher the lookback period, the more accurate your entry and exits may be, when attempting to time when a ticker will cross above or below the midline.
- If "NaN" shows as a result, it means the lookback period is set too high. The ticker has not been around long enough on the requested timeframe to produce a result.
2.) Lookback Period For Highest & Lowest RSI; Above and Below Midline?
- Attempting to sell the top or buy the dip? Exiting and entering as close to the peaks and troughs is a good place to start.
3.) Adjust Big Data Query Label allows the movement of the RSI big data query label left or right based on user preference.
=================================
....🎉🎉🎉Before You Go🎉🎉🎉…..
=================================
Leave a like👍 and/or comment💬.
We appreciate and value everyone's feedback.
Fancy the content? Make sure to follow us🌟 so you don't miss out on our new releases🔥
"Keeping it short and sweet as always"
- assetsandcoffee📈☕
=================================
..📚Indicator Legacy/Definition(s)📖..
=================================
investopedia.com/terms/r/rsi.asp
Script protegido
Este script se publica como código cerrado. No obstante, puede utilizarlo libremente y sin ninguna limitación. Obtenga más información aquí.
Exención de responsabilidad
La información y las publicaciones no constituyen, ni deben considerarse como asesoramiento o recomendaciones financieras, de inversión, de trading o de otro tipo proporcionadas o respaldadas por TradingView. Más información en Condiciones de uso.