OPEN-SOURCE SCRIPT
Logarithmic Bollinger Bands
The existing Bollinger Bands simply used price to derive the standard deviation.
In other words, whether an asset goes up or down by $50 from $100, it counts at the same "50$".
But in the asset market, an increase of $50 and a fall of $50 have different values.
To eliminate this difference using a logarithmic function, a new Bollinger Band was created.
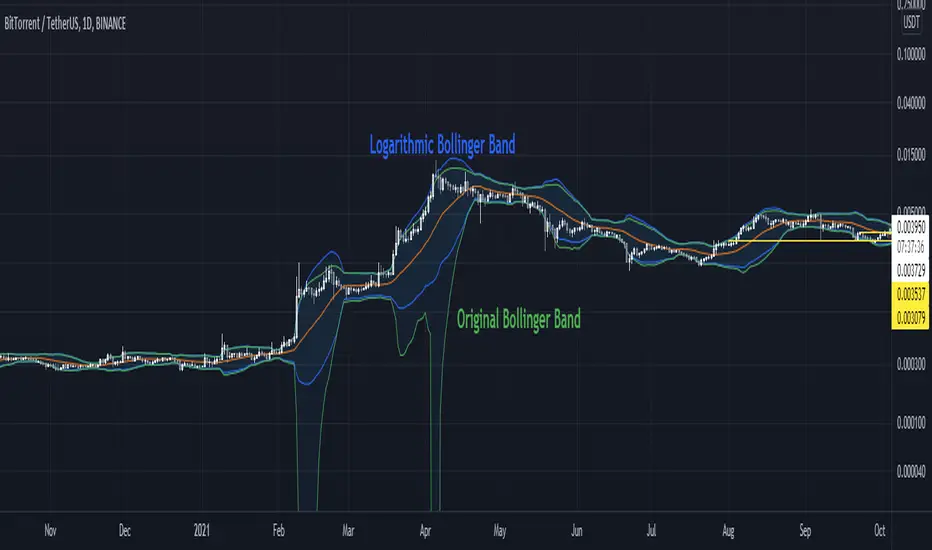
Green is the original Bollinger Band.
As mentioned above, a sharp lower band is formed by calculating the rise and fall of an asset with the same value.
Blue is the Logarithmic Bollinger band.
Please make this indicator useful!
기존의 볼린저 밴드는 단순하게 가격을 이용해 표준편차를 도출해내었습니다.
즉 자산이 100$에서 50$이 오르든 내리든 같은 "50$"로 계산한 것입니다.
하지만 자산시장에서 50$이 오르는 것과 50$이 내리는 것은 다른 가치를 가집니다.
이 차이를 로그함수를 이용해 없애보고자 하였고, 새로운 볼린저밴드를 만들었습니다.
초록색이 기존의 볼린저밴드입니다.
위에서 말했듯이 자산의 오르내림을 같은 가치로 계산해서 급격한 아래 밴드가 형성됩니다.
파란색이 로그 볼린저밴드입니다.
이 지표를 유용하게 사용해주세요!
In other words, whether an asset goes up or down by $50 from $100, it counts at the same "50$".
But in the asset market, an increase of $50 and a fall of $50 have different values.
To eliminate this difference using a logarithmic function, a new Bollinger Band was created.
Green is the original Bollinger Band.
As mentioned above, a sharp lower band is formed by calculating the rise and fall of an asset with the same value.
Blue is the Logarithmic Bollinger band.
Please make this indicator useful!
기존의 볼린저 밴드는 단순하게 가격을 이용해 표준편차를 도출해내었습니다.
즉 자산이 100$에서 50$이 오르든 내리든 같은 "50$"로 계산한 것입니다.
하지만 자산시장에서 50$이 오르는 것과 50$이 내리는 것은 다른 가치를 가집니다.
이 차이를 로그함수를 이용해 없애보고자 하였고, 새로운 볼린저밴드를 만들었습니다.
초록색이 기존의 볼린저밴드입니다.
위에서 말했듯이 자산의 오르내림을 같은 가치로 계산해서 급격한 아래 밴드가 형성됩니다.
파란색이 로그 볼린저밴드입니다.
이 지표를 유용하게 사용해주세요!
Script de código abierto
Fiel al espíritu de TradingView, el creador de este script lo ha convertido en código abierto, para que los traders puedan revisar y verificar su funcionalidad. ¡Enhorabuena al autor! Aunque puede utilizarlo de forma gratuita, recuerde que la republicación del código está sujeta a nuestras Normas internas.
Exención de responsabilidad
La información y las publicaciones no constituyen, ni deben considerarse como asesoramiento o recomendaciones financieras, de inversión, de trading o de otro tipo proporcionadas o respaldadas por TradingView. Más información en Condiciones de uso.