PROTECTED SOURCE SCRIPT
Actualizado ETHBTC Z-Score
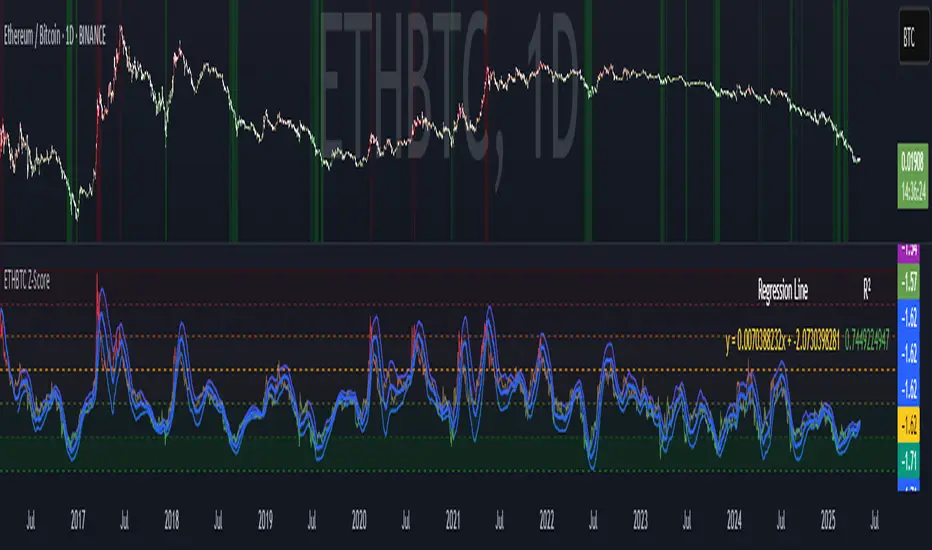
ETHBTC Z-Score Indicator
Key Features
Z-Score Calculation: Measures how far ETHBTC deviates from its mean over a user-defined period.
Linear Regression Line: Tracks the trend of the Z-score using least squares regression.
Standard Deviation Bands: Plots ±N standard deviations around the regression line to show expected Z-score range.
Dynamic Thresholds: Highlights overbought (e.g. Z > 1) and oversold (e.g. Z < -2) zones using color and background fill.
Visual & Table Display: Color-coded bars, horizontal level fills, and optional table showing regression formula and R².
Usage
Spot overbought/oversold extremes when Z-score crosses defined thresholds.
Use the regression line as a dynamic baseline and its bands as range boundaries.
Monitor R² to gauge how well the regression line fits the recent Z-score trend.
Example
Z > 1: ETHBTC may be overbought — potential caution or mean-reversion.
Z < -2: ETHBTC may be oversold — possible buying opportunity.
Z near regression line: Price is in line with recent trend.
Notas de prensa
Updated to work on chart's timeframeScript protegido
Este script se publica como código cerrado. No obstante, puede utilizarlo libremente y sin ninguna limitación. Obtenga más información aquí.
Exención de responsabilidad
La información y las publicaciones no constituyen, ni deben considerarse como asesoramiento o recomendaciones financieras, de inversión, de trading o de otro tipo proporcionadas o respaldadas por TradingView. Más información en Condiciones de uso.
Script protegido
Este script se publica como código cerrado. No obstante, puede utilizarlo libremente y sin ninguna limitación. Obtenga más información aquí.
Exención de responsabilidad
La información y las publicaciones no constituyen, ni deben considerarse como asesoramiento o recomendaciones financieras, de inversión, de trading o de otro tipo proporcionadas o respaldadas por TradingView. Más información en Condiciones de uso.