OPEN-SOURCE SCRIPT
Actualizado Multiple Bollinger Bands + Volatility [AlgoTraderPro]

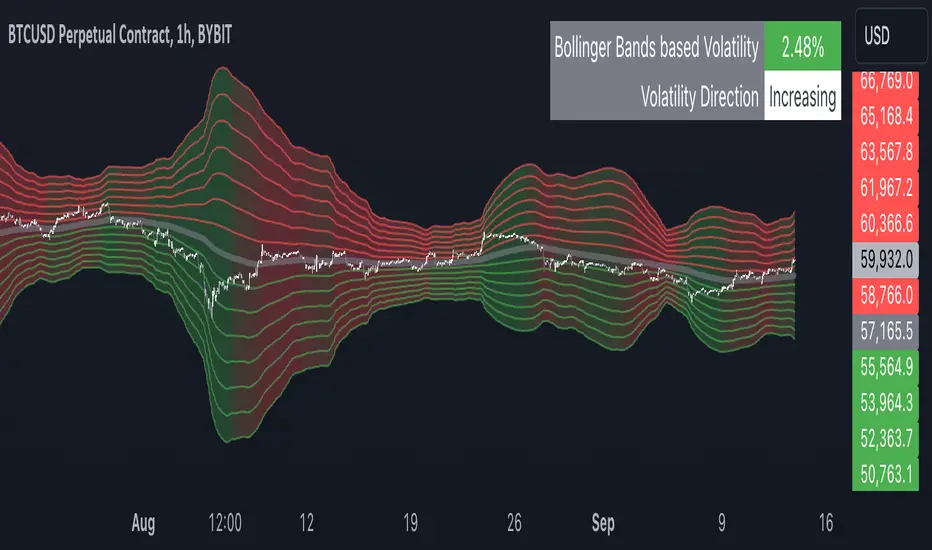
This indicator helps traders visualize price ranges and volatility changes. Designed to assist in identifying potential consolidation zones, the indicator uses multiple layers of Bollinger Bands combined with volatility-based shading. This can help traders spot periods of reduced price movement, which are often followed by breakouts or trend reversals.
█ FEATURES
█ HOW TO USE
█ NOTES
• The indicator is useful in consolidating markets where price movement is limited, offering insights into potential breakout areas.
• Adjust the settings based on asset and market conditions for optimal results.
█ FEATURES
- Multiple Bollinger Bands: Displays up to seven bands with customizable standard deviations, providing a layered view of price range activity.
- Volatility Measurement: Tracks changes in Bollinger Band width to display volatility percentage and direction (increasing, decreasing, or neutral).
- Volatility Shading: Uses color-coded shading between the outermost bands to indicate changes in volatility, helping to visualize potential consolidation zones.
- Customizable Inputs: Modify lookback periods, moving average lengths, and standard deviations for each band to tailor the analysis to your strategy.
- Volatility Table: Displays a table on the chart showing real-time volatility data and direction for quick reference.
█ HOW TO USE
- Add the Indicator: Apply it to your TradingView chart.
- Adjust Settings: Customize the Bollinger Bands’ parameters to suit your trading timeframe and strategy.
- Analyze Consolidation Zones: Use the multiple bands and volatility shading to identify areas of reduced price activity, signaling potential breakouts.
- Monitor Volatility: Refer to the volatility table to track real-time shifts in market volatility.
- Use in Different Markets: Adapt the settings for various assets and timeframes to assess market conditions effectively.
█ NOTES
• The indicator is useful in consolidating markets where price movement is limited, offering insights into potential breakout areas.
• Adjust the settings based on asset and market conditions for optimal results.
Notas de prensa
Bug fixes.Notas de prensa
Minor fixes.Script de código abierto
Fiel al espíritu de TradingView, el creador de este script lo ha convertido en código abierto, para que los traders puedan revisar y verificar su funcionalidad. ¡Enhorabuena al autor! Aunque puede utilizarlo de forma gratuita, recuerde que la republicación del código está sujeta a nuestras Normas internas.
Trade Smarter, Not Harder!
TradeCreator9
algotraderpro.io/tradecreator9/
TradeCreator9
algotraderpro.io/tradecreator9/
Exención de responsabilidad
La información y las publicaciones no constituyen, ni deben considerarse como asesoramiento o recomendaciones financieras, de inversión, de trading o de otro tipo proporcionadas o respaldadas por TradingView. Más información en Condiciones de uso.
Script de código abierto
Fiel al espíritu de TradingView, el creador de este script lo ha convertido en código abierto, para que los traders puedan revisar y verificar su funcionalidad. ¡Enhorabuena al autor! Aunque puede utilizarlo de forma gratuita, recuerde que la republicación del código está sujeta a nuestras Normas internas.
Trade Smarter, Not Harder!
TradeCreator9
algotraderpro.io/tradecreator9/
TradeCreator9
algotraderpro.io/tradecreator9/
Exención de responsabilidad
La información y las publicaciones no constituyen, ni deben considerarse como asesoramiento o recomendaciones financieras, de inversión, de trading o de otro tipo proporcionadas o respaldadas por TradingView. Más información en Condiciones de uso.