OPEN-SOURCE SCRIPT
Candle Strength
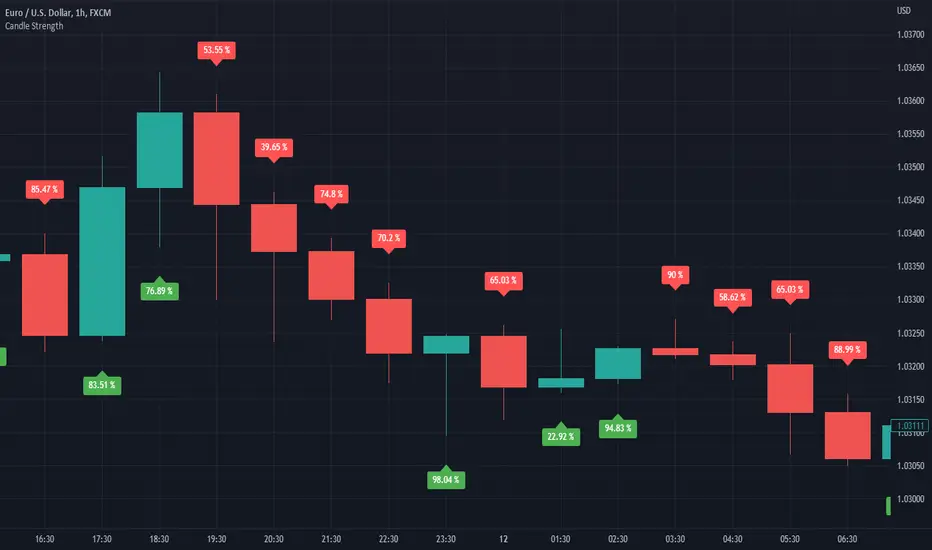
It is hard to know which party plays a vital role in the candle. Sometimes we see a red candle/ Seller's candle very weak, but still, the market continues. Here, I tried to figure out how much strength buyers/sellers possess in their respective candles.
The idea is simply to measure the area between high and low and then calculate the opposite party's oppression by calculating the wick's area.
This script is more like a tool, and hence I do not suggest using this as an independent strategy. However, combining it with other analyses and strategies will surely bear fruitful results.
I, in the future, will come up with strategies and more tools like this.
So, follow me to keep getting updates.
Thanks.
Script de código abierto
Fiel al espíritu de TradingView, el creador de este script lo ha convertido en código abierto, para que los traders puedan revisar y verificar su funcionalidad. ¡Enhorabuena al autor! Aunque puede utilizarlo de forma gratuita, recuerde que la republicación del código está sujeta a nuestras Normas internas.
Exención de responsabilidad
La información y las publicaciones no constituyen, ni deben considerarse como asesoramiento o recomendaciones financieras, de inversión, de trading o de otro tipo proporcionadas o respaldadas por TradingView. Más información en Condiciones de uso.