OPEN-SOURCE SCRIPT
Actualizado Blood Moons
Blood Moon Dates
Description:
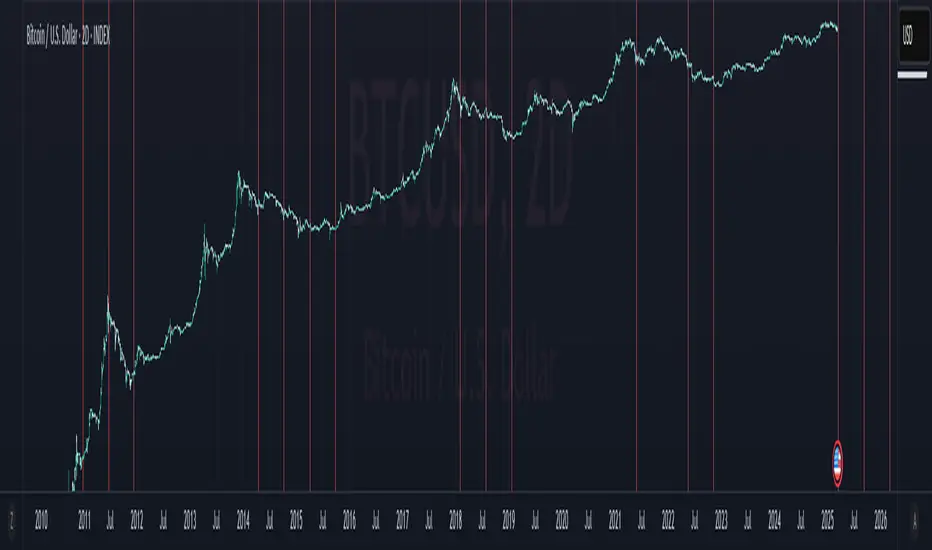
This indicator overlays vertical lines on your chart to mark the dates of total lunar eclipses (commonly known as "Blood Moons") from December 2010 to May 2040. Designed with cryptocurrency traders in mind, it’s perfect for analyzing potential correlations between these celestial events and price movements. The lines are drawn on the first bar and extend across the chart, making it easy to spot these dates on any timeframe.
Features:
Plots vertical lines for 19 Blood Moon events (2010–2040).
Customizable line color, style (solid, dotted, dashed), and width.
Option to toggle lines on/off for a cleaner chart.
Lines extend both ways for maximum visibility across your chart.
Settings:
Show Lines: Enable or disable the lines (default: enabled).
Line Color: Choose your preferred color (default: red).
Line Style: Select solid, dotted, or dashed (default: dotted).
Line Width: Adjust thickness from 1 to 5 (default: 2).
Usage:
Add this indicator to your chart to visualize Blood Moon dates alongside price action. Customize the appearance to suit your analysis style. Note: Lines are plotted based on timestamps and extend across the chart, so they’re best viewed on daily or higher timeframes for clarity.
Disclaimer:
This is an educational tool and not financial advice. Past performance does not guarantee future results. Use at your own risk.
Description:
This indicator overlays vertical lines on your chart to mark the dates of total lunar eclipses (commonly known as "Blood Moons") from December 2010 to May 2040. Designed with cryptocurrency traders in mind, it’s perfect for analyzing potential correlations between these celestial events and price movements. The lines are drawn on the first bar and extend across the chart, making it easy to spot these dates on any timeframe.
Features:
Plots vertical lines for 19 Blood Moon events (2010–2040).
Customizable line color, style (solid, dotted, dashed), and width.
Option to toggle lines on/off for a cleaner chart.
Lines extend both ways for maximum visibility across your chart.
Settings:
Show Lines: Enable or disable the lines (default: enabled).
Line Color: Choose your preferred color (default: red).
Line Style: Select solid, dotted, or dashed (default: dotted).
Line Width: Adjust thickness from 1 to 5 (default: 2).
Usage:
Add this indicator to your chart to visualize Blood Moon dates alongside price action. Customize the appearance to suit your analysis style. Note: Lines are plotted based on timestamps and extend across the chart, so they’re best viewed on daily or higher timeframes for clarity.
Disclaimer:
This is an educational tool and not financial advice. Past performance does not guarantee future results. Use at your own risk.
Notas de prensa
quality of life with auto scaling issueswould prefer vertical lines but pinescript is too picky with those
opting for shapes instead
Notas de prensa
script name fix from BM Balls to Blood MoonsNotas de prensa
fixed bugwill have to check in a couple days whether that blood moon date prints a shape
Notas de prensa
updating default color/transpNotas de prensa
reverting to near original, pinescript sucks btwNotas de prensa
updated future datesScript de código abierto
Fiel al espíritu de TradingView, el creador de este script lo ha convertido en código abierto, para que los traders puedan revisar y verificar su funcionalidad. ¡Enhorabuena al autor! Aunque puede utilizarlo de forma gratuita, recuerde que la republicación del código está sujeta a nuestras Normas internas.
Exención de responsabilidad
La información y las publicaciones no constituyen, ni deben considerarse como asesoramiento o recomendaciones financieras, de inversión, de trading o de otro tipo proporcionadas o respaldadas por TradingView. Más información en Condiciones de uso.
Script de código abierto
Fiel al espíritu de TradingView, el creador de este script lo ha convertido en código abierto, para que los traders puedan revisar y verificar su funcionalidad. ¡Enhorabuena al autor! Aunque puede utilizarlo de forma gratuita, recuerde que la republicación del código está sujeta a nuestras Normas internas.
Exención de responsabilidad
La información y las publicaciones no constituyen, ni deben considerarse como asesoramiento o recomendaciones financieras, de inversión, de trading o de otro tipo proporcionadas o respaldadas por TradingView. Más información en Condiciones de uso.