OPEN-SOURCE SCRIPT
Institutional Moves Detector
Indicator Name: Institutional Pattern Detector
What It Does:
Trend Following: It uses a Moving Average (MA) to understand the general direction of the price. The MA is like a smoothed-out line of the price over time, showing if the price trend is going up or down.
Volatility Measurement: The script employs Bollinger Bands (BB) to see how much the price is fluctuating. Bollinger Bands create an upper and lower "channel" around the price, which gets wider or narrower based on how volatile the price is.
Volume Check: It looks at trading volume to find times when there's unusually high activity, which could mean big players (institutions like banks or funds) are trading. It flags this when the volume is 1.5 times more than the average volume of the last 100 bars.
Pattern Detection for Trading Signals:
Entry Signal ("IN"): When there's high volume and the price is above the upper Bollinger Band, it suggests there might be strong buying from big institutions. This could mean the price might keep going up.
EXIT Signal ("OUT"): If there's high volume and the price falls below the lower Bollinger Band, it indicates possible strong selling pressure from institutions, suggesting the price might go down.
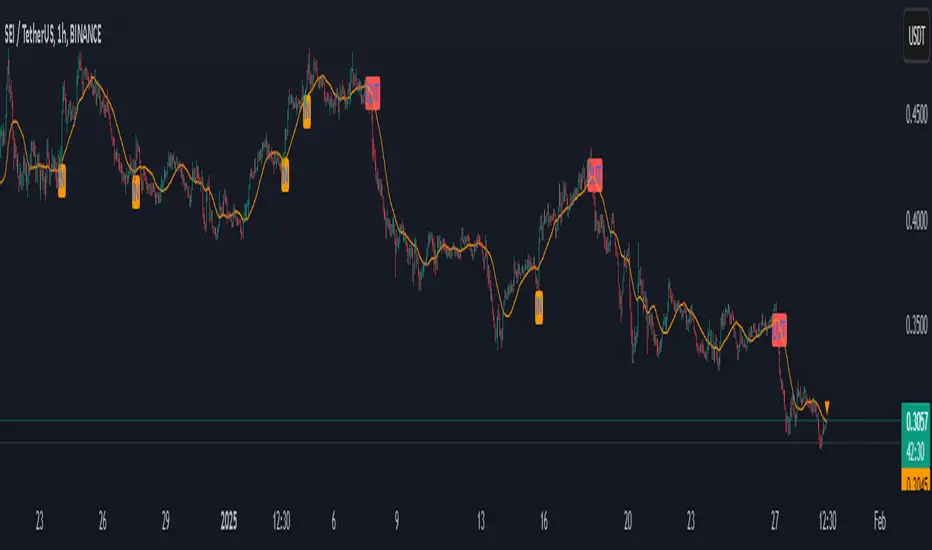
Visual Cues:
An orange label "IN" appears below the price bar for entry signals.
A red label "OUT" appears above the price bar for exit signals.
The moving average line is plotted on the chart in orange to help you see the trend.
Alerts: The script can alert you when these entry or exit signals occur, so you can get notifications without needing to stare at the chart all day.
For New Traders:
This indicator helps you spot when big traders might be influencing the market, potentially giving you a clue about when to enter or exit.
Remember, this is one tool among many. You should not base your trading solely on this; combine it with other analysis methods.
It's always wise to practice with a demo account before using real money to get a feel for how these signals work in actual market conditions.
What It Does:
Trend Following: It uses a Moving Average (MA) to understand the general direction of the price. The MA is like a smoothed-out line of the price over time, showing if the price trend is going up or down.
Volatility Measurement: The script employs Bollinger Bands (BB) to see how much the price is fluctuating. Bollinger Bands create an upper and lower "channel" around the price, which gets wider or narrower based on how volatile the price is.
Volume Check: It looks at trading volume to find times when there's unusually high activity, which could mean big players (institutions like banks or funds) are trading. It flags this when the volume is 1.5 times more than the average volume of the last 100 bars.
Pattern Detection for Trading Signals:
Entry Signal ("IN"): When there's high volume and the price is above the upper Bollinger Band, it suggests there might be strong buying from big institutions. This could mean the price might keep going up.
EXIT Signal ("OUT"): If there's high volume and the price falls below the lower Bollinger Band, it indicates possible strong selling pressure from institutions, suggesting the price might go down.
Visual Cues:
An orange label "IN" appears below the price bar for entry signals.
A red label "OUT" appears above the price bar for exit signals.
The moving average line is plotted on the chart in orange to help you see the trend.
Alerts: The script can alert you when these entry or exit signals occur, so you can get notifications without needing to stare at the chart all day.
For New Traders:
This indicator helps you spot when big traders might be influencing the market, potentially giving you a clue about when to enter or exit.
Remember, this is one tool among many. You should not base your trading solely on this; combine it with other analysis methods.
It's always wise to practice with a demo account before using real money to get a feel for how these signals work in actual market conditions.
Script de código abierto
Fiel al espíritu de TradingView, el creador de este script lo ha convertido en código abierto, para que los traders puedan revisar y verificar su funcionalidad. ¡Enhorabuena al autor! Aunque puede utilizarlo de forma gratuita, recuerde que la republicación del código está sujeta a nuestras Normas internas.
🌐🔗💻PREMIUM INDICATORS💎🤑💰💰 - botboost.in
➤🌐⌯⌲➣ TELEGRAM GROUP - t.me/tradingarmourofficial ➤🌐⌯⌲➣
➤🌐⌯⌲➣ TELEGRAM GROUP - t.me/tradingarmourofficial ➤🌐⌯⌲➣
Exención de responsabilidad
La información y las publicaciones no constituyen, ni deben considerarse como asesoramiento o recomendaciones financieras, de inversión, de trading o de otro tipo proporcionadas o respaldadas por TradingView. Más información en Condiciones de uso.