OPEN-SOURCE SCRIPT
BANK NIFTY list of stocks with their multi timeframe EMA trend
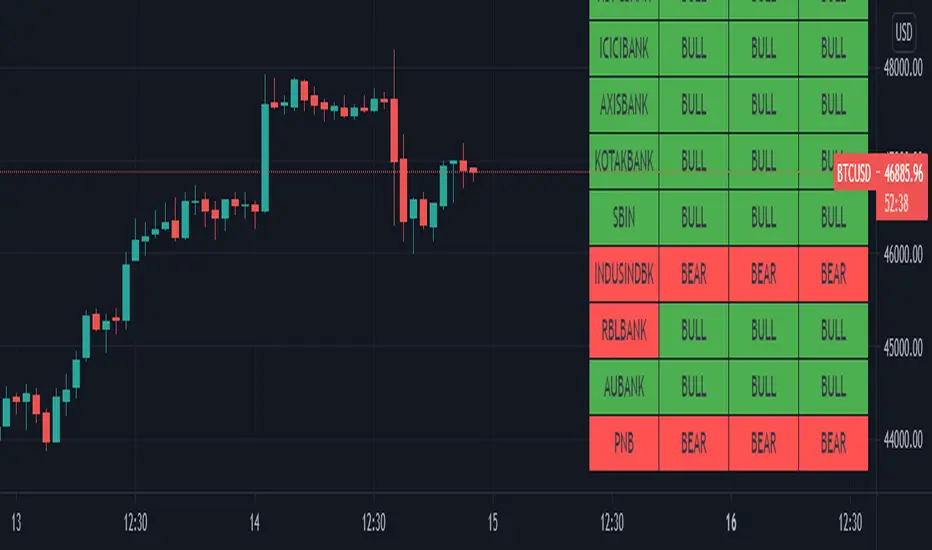
This script gives you an overview of banknifty and its underlying heavy weight stocks.
You can view the trend in single chart in 3 different time frames.
Color indication green for bullish and red for bearish trend
Symbol name shows green if the current day change is positive. Else red color
You can view the trend in single chart in 3 different time frames.
Color indication green for bullish and red for bearish trend
Symbol name shows green if the current day change is positive. Else red color
Script de código abierto
Fiel al espíritu de TradingView, el creador de este script lo ha convertido en código abierto, para que los traders puedan revisar y verificar su funcionalidad. ¡Enhorabuena al autor! Aunque puede utilizarlo de forma gratuita, recuerde que la republicación del código está sujeta a nuestras Normas internas.
Exención de responsabilidad
La información y las publicaciones no constituyen, ni deben considerarse como asesoramiento o recomendaciones financieras, de inversión, de trading o de otro tipo proporcionadas o respaldadas por TradingView. Más información en Condiciones de uso.