PROTECTED SOURCE SCRIPT
Actualizado MACD X Pivot
The Theory of Entanglement (缠论) is one of the most widely studied trading theories in China, but it is much less known among traders outside. Fractals, strokes, line segments and pivots are basic elements in the Theory of Entanglement. This indicator, MACD X Pivot, applies the concept of strokes, line segment and pivot to the classic MACD indicator and provides a good indication of the exact turning point of a trend based on MACD divergence. Also see a related indicator for applying the Theory of Entanglement on the price chart: tradingview.com/script/5khLVtBp/.
Relations between stroke, line segment and pivot:
• Stroke: Connecting two adjacent top and bottom fractals with at least one candlestick in between.
• Line segment: Consists of an odd number of strokes, at least three strokes are required, and the first three strokes must have overlapping parts.
• Pivot: The part of a trend type at a certain level that is overlapped by at least three consecutive sub-level trend types.
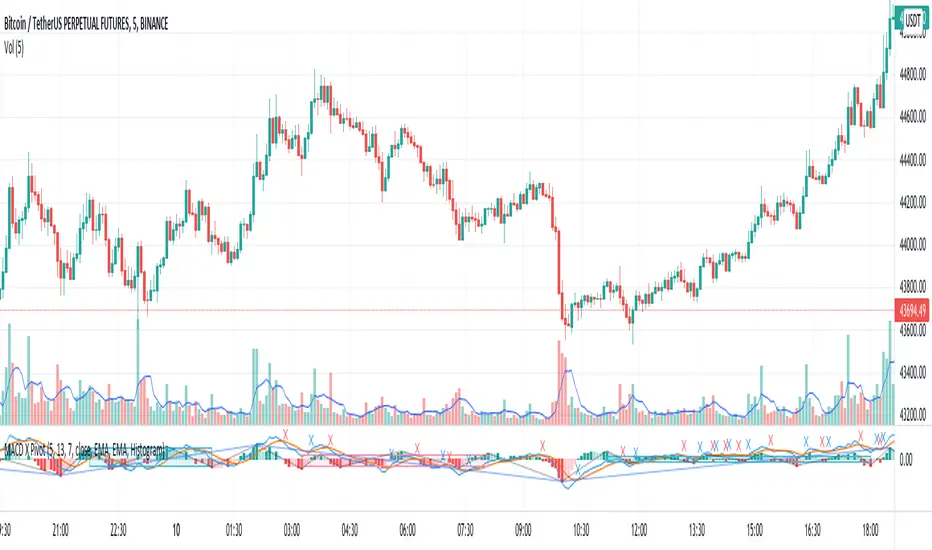
List of drawings on the chart:
1. Blue and red crosses: golden and death crosses between MACD and signal lines.
1. Gray lines: Strokes at the current level.
2. Blue lines: Strokes at a higher level, also line segments at the current level.
3. Blue shaded rectangles: Bullish pivot.
4. Red shaded rectangles: Bearish pivot.
How to use the indicator:
1. The golden cross and death cross between the MACD and signal lines: Blue cross: MACD line crosses up the signal line - buy signal; Red cross: MACD line crosses down the signal line: sell signal.
2. For the bullish blue pivot, the 2nd low (higher low) provides a good indication of the exact turning point from a bearish to bullish trend.
3. For the bearish red pivot, the 2nd high (lower high) provides a good indication of the exact turning point from a bullish to bearish trend.
Relations between stroke, line segment and pivot:
• Stroke: Connecting two adjacent top and bottom fractals with at least one candlestick in between.
• Line segment: Consists of an odd number of strokes, at least three strokes are required, and the first three strokes must have overlapping parts.
• Pivot: The part of a trend type at a certain level that is overlapped by at least three consecutive sub-level trend types.
List of drawings on the chart:
1. Blue and red crosses: golden and death crosses between MACD and signal lines.
1. Gray lines: Strokes at the current level.
2. Blue lines: Strokes at a higher level, also line segments at the current level.
3. Blue shaded rectangles: Bullish pivot.
4. Red shaded rectangles: Bearish pivot.
How to use the indicator:
1. The golden cross and death cross between the MACD and signal lines: Blue cross: MACD line crosses up the signal line - buy signal; Red cross: MACD line crosses down the signal line: sell signal.
2. For the bullish blue pivot, the 2nd low (higher low) provides a good indication of the exact turning point from a bearish to bullish trend.
3. For the bearish red pivot, the 2nd high (lower high) provides a good indication of the exact turning point from a bullish to bearish trend.
Notas de prensa
Modified several input parameters to improve signal reliability.Notas de prensa
Separated input parameter settings for MACD, signal lines and histogram.Notas de prensa
1. Added a new MACD line for identifying higher-level divergence. 2. Adjusted scales of MACD and signal lines and height of histogram for better clarity.Notas de prensa
Minor bug fix.Script protegido
Este script se publica como código cerrado. No obstante, puede utilizarlo libremente y sin ninguna limitación. Obtenga más información aquí.
Exención de responsabilidad
La información y las publicaciones no constituyen, ni deben considerarse como asesoramiento o recomendaciones financieras, de inversión, de trading o de otro tipo proporcionadas o respaldadas por TradingView. Más información en Condiciones de uso.
Script protegido
Este script se publica como código cerrado. No obstante, puede utilizarlo libremente y sin ninguna limitación. Obtenga más información aquí.
Exención de responsabilidad
La información y las publicaciones no constituyen, ni deben considerarse como asesoramiento o recomendaciones financieras, de inversión, de trading o de otro tipo proporcionadas o respaldadas por TradingView. Más información en Condiciones de uso.