OPEN-SOURCE SCRIPT
RSI - ARIEIV
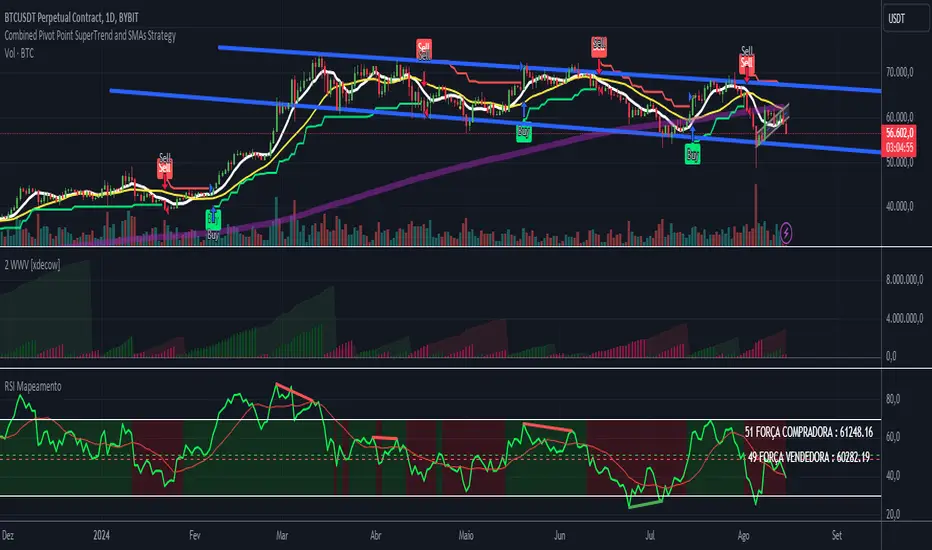
he RSI MAPPING - ARIEIV is a powerful technical indicator based on the Relative Strength Index (RSI) combined with moving averages and divergence detection. This indicator is designed to provide a clear view of overbought and oversold conditions, as well as identifying potential reversals and signals for market entries and exits.
Key Features:
Customizable RSI:
The indicator offers flexibility in adjusting the RSI length and data source (closing price, open price, etc.).
The overbought and oversold lines can be customized, allowing the RSI to signal critical market zones according to the trader’s strategy.
RSI-Based Moving Averages (MA):
Users can enable a moving average based on the RSI with support for multiple types such as SMA, EMA, WMA, VWMA, and SMMA (RMA).
For those who prefer Bollinger Bands, there’s an option to use the moving average with standard deviation to detect market volatility.
Divergence Detection:
Detects both regular and hidden divergences (bullish and bearish) between price and RSI, which can indicate potential market reversals.
These divergences can be customized with specific colors for easy identification on the chart, allowing traders to quickly spot significant market shifts.
Zone Mapping:
The script maps zones of buying and selling strength, filling the areas between the overbought and oversold levels with specific colors, highlighting when the market is in extreme conditions.
Strength Tables:
At the end of each session, a table appears on the right side of the chart, displaying the "Buying Strength" and "Selling Strength" based on calculated RSI levels. This allows for quick analysis of the dominant pressure in the market.
Flexible Settings:
Many customization options are available, from adjusting the number of decimal places to the choice of colors and the ability to toggle elements on or off within the chart.
Script de código abierto
Fiel al espíritu de TradingView, el creador de este script lo ha convertido en código abierto, para que los traders puedan revisar y verificar su funcionalidad. ¡Enhorabuena al autor! Aunque puede utilizarlo de forma gratuita, recuerde que la republicación del código está sujeta a nuestras Normas internas.
Exención de responsabilidad
La información y las publicaciones no constituyen, ni deben considerarse como asesoramiento o recomendaciones financieras, de inversión, de trading o de otro tipo proporcionadas o respaldadas por TradingView. Más información en Condiciones de uso.