OPEN-SOURCE SCRIPT
Actualizado SAT - Sentiment Analysis Tool by Csth97
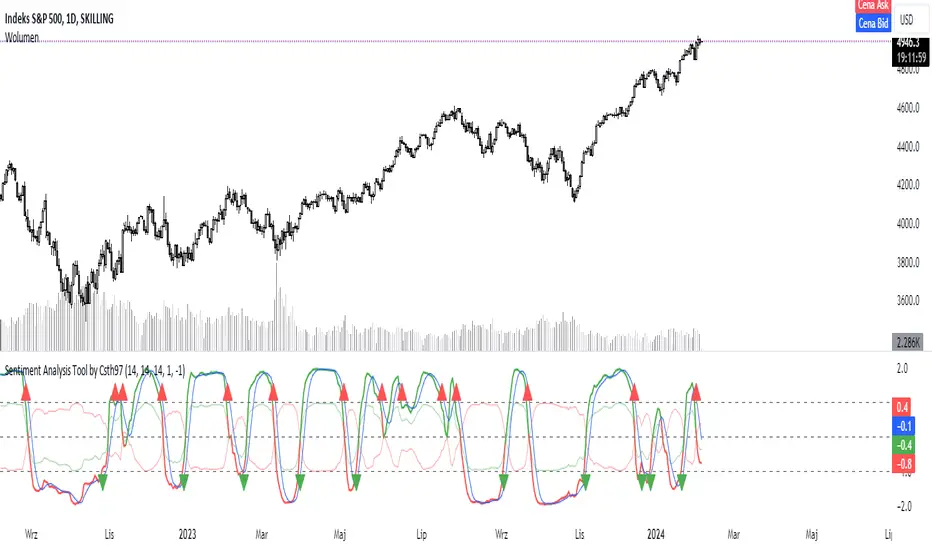
This code calculates the correlation between the ATR and the OBV of the price, and plots the difference between the positive and negative OBV correlations as a line. It also plots horizontal lines at the UP and DOWN levels, and signals bullish and bearish crosses when the difference line crosses those levels.
Notas de prensa
// This code calculates the correlation between the ATR and the OBV of the price, and plots the difference between the positive and negative OBV correlations as a line.//It also plots horizontal lines at the UP and DOWN levels, and signals bullish and bearish crosses when the difference line crosses those levels.
Script de código abierto
Fiel al espíritu de TradingView, el creador de este script lo ha convertido en código abierto, para que los traders puedan revisar y verificar su funcionalidad. ¡Enhorabuena al autor! Aunque puede utilizarlo de forma gratuita, recuerde que la republicación del código está sujeta a nuestras Normas internas.
Exención de responsabilidad
La información y las publicaciones no constituyen, ni deben considerarse como asesoramiento o recomendaciones financieras, de inversión, de trading o de otro tipo proporcionadas o respaldadas por TradingView. Más información en Condiciones de uso.