OPEN-SOURCE SCRIPT
Stocks Advance/Decline Histogram
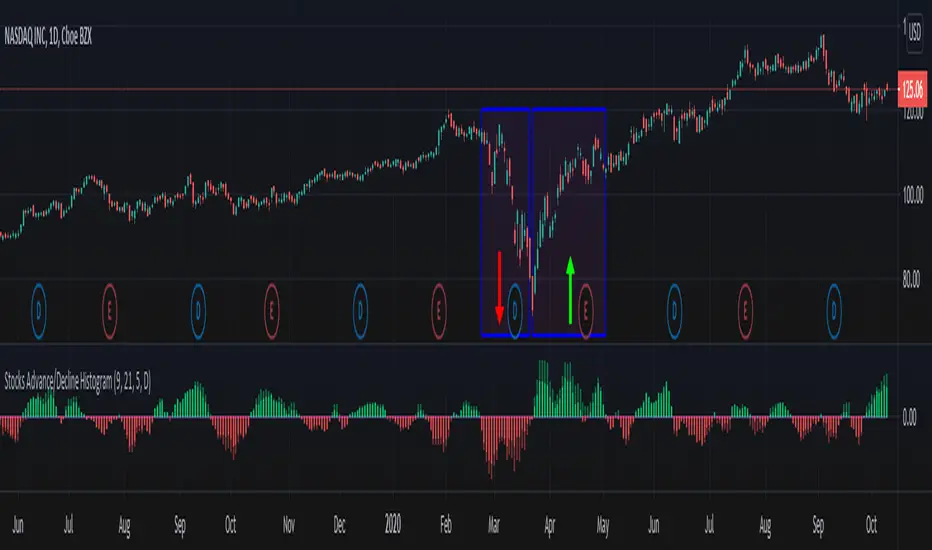
Stocks Advance/Decline Histogram indicator, which I call ADH is my own implementation that plots an histogram of the difference between the number of advancing and declining stocks on a daily basis (or higher time frame) for the NASDAQ and NYSE.
How to use it?
Green: More NYSE stocks are advancing than declining.
Red: More NYSE stocks are declining than advancing.
Light Green: More NASDAQ stocks are advancing than declining.
Light Red: More NASDAQ stocks are declining than advancing.
Note: Advance/Decline data is based on daily or higher time frames.
Script de código abierto
Fiel al espíritu de TradingView, el creador de este script lo ha convertido en código abierto, para que los traders puedan revisar y verificar su funcionalidad. ¡Enhorabuena al autor! Aunque puede utilizarlo de forma gratuita, recuerde que la republicación del código está sujeta a nuestras Normas internas.
Appreciation of my work: paypal.me/dman103
All Premium indicators: algo.win
LIVE Stream - Pivot Points Algo: youtube.com/channel/UCFyqab-i0xb2jf-c18ufH0A/live
All Premium indicators: algo.win
LIVE Stream - Pivot Points Algo: youtube.com/channel/UCFyqab-i0xb2jf-c18ufH0A/live
Exención de responsabilidad
La información y las publicaciones no constituyen, ni deben considerarse como asesoramiento o recomendaciones financieras, de inversión, de trading o de otro tipo proporcionadas o respaldadas por TradingView. Más información en Condiciones de uso.