OPEN-SOURCE SCRIPT
SMA Ribbon [A]

SMA Ribbon with Adjustable MA200
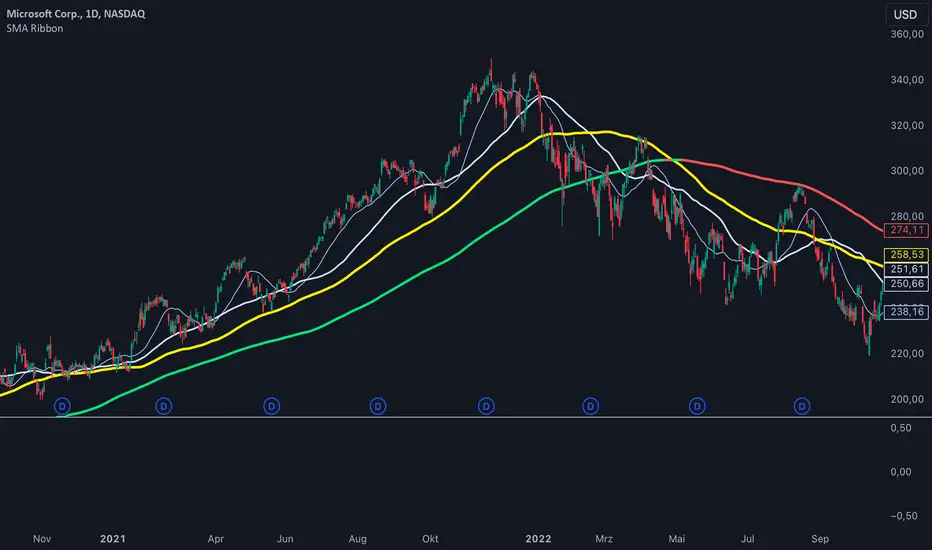
20, 50, 100, and 200-period Simple Moving Averages (SMAs) for trend analysis.
The SMA200 dynamically changes color based on its direction—green when rising and red when falling. Additionally, you can lock the SMA200 to the daily timeframe, allowing it to display the 200-day moving average on lower timeframes, such as 4-hour or 1-hour charts.
Features:
How to Use:
This script is ideal for traders seeking a clean and customizable tool for long-term and short-term trend analysis.
20, 50, 100, and 200-period Simple Moving Averages (SMAs) for trend analysis.
The SMA200 dynamically changes color based on its direction—green when rising and red when falling. Additionally, you can lock the SMA200 to the daily timeframe, allowing it to display the 200-day moving average on lower timeframes, such as 4-hour or 1-hour charts.
Features:
- Dynamic SMA200 Color: Automatically adjusts to show upward (green) or downward (red) trends.
- Daily SMA200 Option: Enables the SMA200 to represent the 200-day moving average on intraday charts for long-term trend insights.
- Smart Adaptation: The daily SMA200 setting is automatically disabled on daily or higher timeframes, ensuring accurate period calculations.
How to Use:
- Use this script to identify key support/resistance levels and overall market trends.
- Adjust the "Daily MA for MA200" option in the settings to toggle between timeframe-specific and daily-locked SMA200.
This script is ideal for traders seeking a clean and customizable tool for long-term and short-term trend analysis.
Script de código abierto
Fiel al espíritu de TradingView, el creador de este script lo ha convertido en código abierto, para que los traders puedan revisar y verificar su funcionalidad. ¡Enhorabuena al autor! Aunque puede utilizarlo de forma gratuita, recuerde que la republicación del código está sujeta a nuestras Normas internas.
Exención de responsabilidad
La información y las publicaciones no constituyen, ni deben considerarse como asesoramiento o recomendaciones financieras, de inversión, de trading o de otro tipo proporcionadas o respaldadas por TradingView. Más información en Condiciones de uso.