OPEN-SOURCE SCRIPT
Actualizado Price Density (Market Noise) by Alejandro P
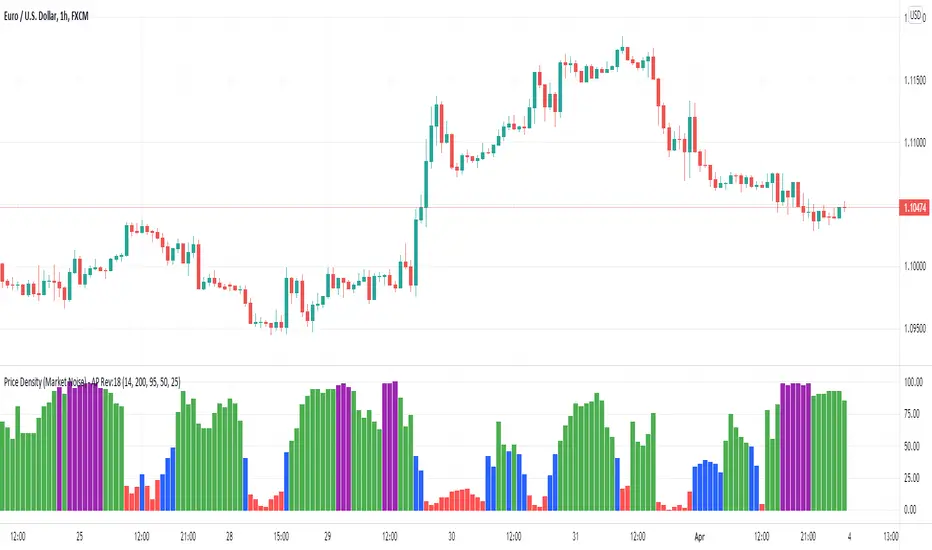
This is an indicator based on the Price Density concept. Price Density is a quantifiable method of measuring market noise for a certain period of candles.
This indicator also has the option to use relative percentile values which transforms the indicator from an absolute value measure to a percentile based measure so it can be more easily compared across vastly different assets.
We can use Price Density to set rules and only trade particular systems when noise is at an appropriate level. For example, if noise is high then we would want to avoid trend following strategies and instead trade mean-reversion strategies, and vice-versa when the opposite is true. Price Density can also be used to match assets to strategies. Some assets will be naturally more noisy than others and therefore we might have a principle where we only trade those noisy assets with our mean reversion strategies and the more quiet assets with trend following strategies.
Price Density can be used by looking at indicator and seeing how efficiently the indicator line moves from one side to the other. Is it in a straight line? Or are there lots of zigs and zags? The straighter the line, the less market noise there is.
Calculations:
Price Density = Sum(ATR(1), Length) / (Max(High) - Min(Low))
The numerator on top looks at the high of each of the bars, the low of a bar, calculates the difference and then sums up all of those values for the time period. This gives us an idea of the fluctuation of the individual price moves. Next, the denominator uses the maximum value from all of the highs of those bars and subtracts the minimum low out of all of the bars. This gives us the range or the height of the box and so if there's a lot of price fluctuation compared to the actual range this means we'll have a high value which gives the indication that we have high levels of noise. If however those individual fluctuations are small compared to the range this means we'll get a low value for the price density and therefore have low levels of noise.
Notas de prensa
Updated to pinescript V5Script de código abierto
In true TradingView spirit, the creator of this script has made it open-source, so that traders can review and verify its functionality. Kudos to the author! While you can use it for free, remember that republishing the code is subject to our House Rules.
Exención de responsabilidad
The information and publications are not meant to be, and do not constitute, financial, investment, trading, or other types of advice or recommendations supplied or endorsed by TradingView. Read more in the Terms of Use.
Script de código abierto
In true TradingView spirit, the creator of this script has made it open-source, so that traders can review and verify its functionality. Kudos to the author! While you can use it for free, remember that republishing the code is subject to our House Rules.
Exención de responsabilidad
The information and publications are not meant to be, and do not constitute, financial, investment, trading, or other types of advice or recommendations supplied or endorsed by TradingView. Read more in the Terms of Use.