OPEN-SOURCE SCRIPT
Actualizado ADX and DI delta
Just a small adjustment to a well known indicator, the ADX with +DI and -DI.
I've always been annoyed of how cluttered this indicator is, specially do to the increasing gap between +DI and -DI, so I changed it up a bit.
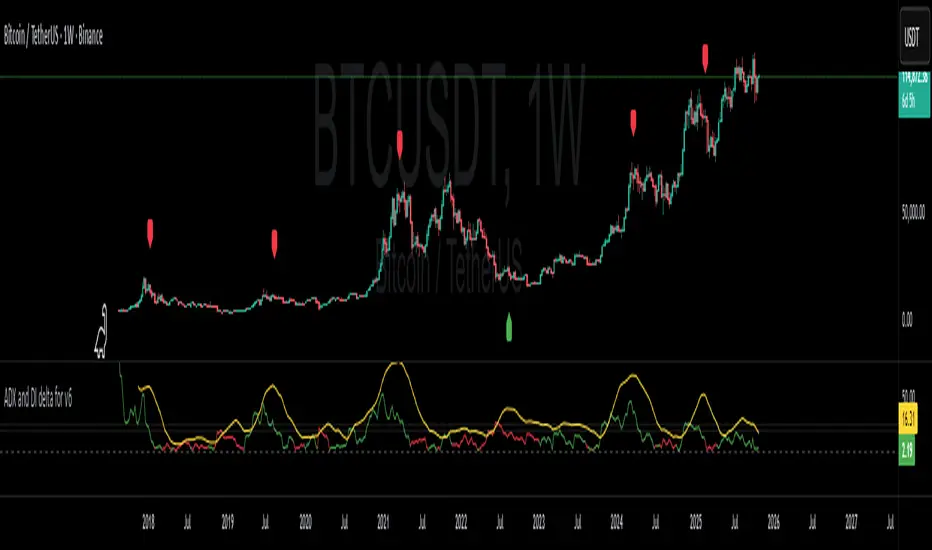
Now you only have the ADX line together with a delta line.
The delta line is the gap between +DI and -DI and will change color depending on which one is highest and controlling the trend.
+DI = green line
-DI = red line
I've also added both a 20 and 25 horizontal dotted line.
Normally ADX should be 25 or higher to start a trend, but I do know a lot of people like to be greedy and jump in early in the trend build-up.
A dashed 0 line has been added, just because I felt like it. If either the ADX or delta ever cross below it without you editing the script yourself, just delete the script as it clearly doesn't do its job.
A red label_down will be plotted above the price when the ADX starts curling down and +DI > -DI. This indicates at best a breather for a bullish up trend or a possible reversal.
A red label_down will be plotted above the price if the ADX is above 25 and starts curling down while +DI > -DI. This indicates at best a breather for a bullish up trend or a possible reversal.
A green label_up will be plotted below the price if the ADX is above 25 and starts curling down while -DI > +DI. This indicates at best a breather for a bearish down trend or a possible reversal.
Enjoy my take on the indicator.
I've always been annoyed of how cluttered this indicator is, specially do to the increasing gap between +DI and -DI, so I changed it up a bit.
- ADX line has not been adjusted
- +DI and -DI have now merged into deltaDI
- deltaDI changes color depending on which value is higher (+DI > -DI = green line, else red line)
- Plots a dashed 0 line (not editable)
- Plots a two dotted lines at value 20 and 25 (editable)
- Plots a label above/below price on the chart if the trend is exhausted and might end. (can be disabled)
Now you only have the ADX line together with a delta line.
The delta line is the gap between +DI and -DI and will change color depending on which one is highest and controlling the trend.
+DI = green line
-DI = red line
I've also added both a 20 and 25 horizontal dotted line.
Normally ADX should be 25 or higher to start a trend, but I do know a lot of people like to be greedy and jump in early in the trend build-up.
A dashed 0 line has been added, just because I felt like it. If either the ADX or delta ever cross below it without you editing the script yourself, just delete the script as it clearly doesn't do its job.
A red label_down will be plotted above the price when the ADX starts curling down and +DI > -DI. This indicates at best a breather for a bullish up trend or a possible reversal.
A red label_down will be plotted above the price if the ADX is above 25 and starts curling down while +DI > -DI. This indicates at best a breather for a bullish up trend or a possible reversal.
A green label_up will be plotted below the price if the ADX is above 25 and starts curling down while -DI > +DI. This indicates at best a breather for a bearish down trend or a possible reversal.
Enjoy my take on the indicator.
Notas de prensa
Had forgotten to add the "ADX > 25" trigger for plotting the label like an idiot.Script de código abierto
Fiel al espíritu de TradingView, el creador de este script lo ha convertido en código abierto, para que los traders puedan revisar y verificar su funcionalidad. ¡Enhorabuena al autor! Aunque puede utilizarlo de forma gratuita, recuerde que la republicación del código está sujeta a nuestras Normas internas.
Exención de responsabilidad
La información y las publicaciones no constituyen, ni deben considerarse como asesoramiento o recomendaciones financieras, de inversión, de trading o de otro tipo proporcionadas o respaldadas por TradingView. Más información en Condiciones de uso.
Script de código abierto
Fiel al espíritu de TradingView, el creador de este script lo ha convertido en código abierto, para que los traders puedan revisar y verificar su funcionalidad. ¡Enhorabuena al autor! Aunque puede utilizarlo de forma gratuita, recuerde que la republicación del código está sujeta a nuestras Normas internas.
Exención de responsabilidad
La información y las publicaciones no constituyen, ni deben considerarse como asesoramiento o recomendaciones financieras, de inversión, de trading o de otro tipo proporcionadas o respaldadas por TradingView. Más información en Condiciones de uso.