OPEN-SOURCE SCRIPT
Multi-Timeframe VWAP Strategy [JARUTIR]

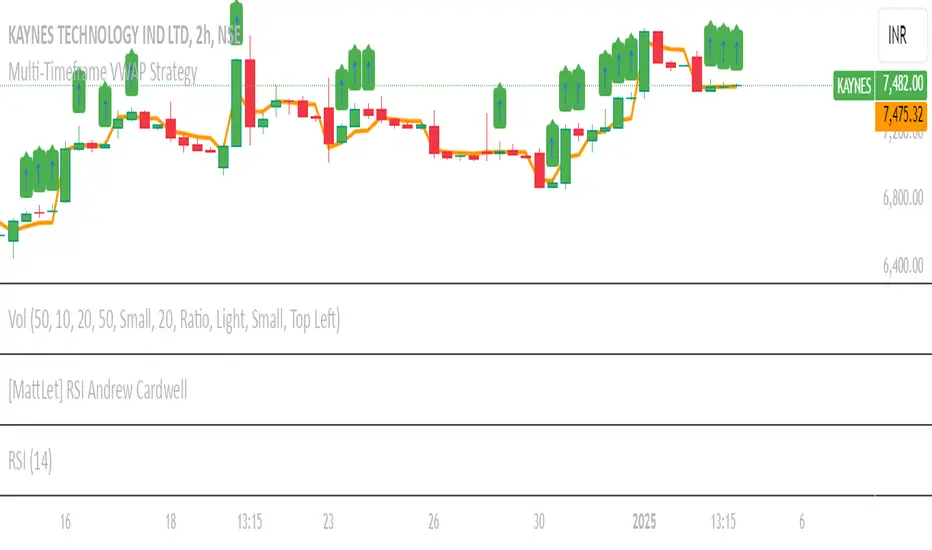
Multi-Timeframe VWAP with Price Above VWAP Marker
This indicator allows you to view the Volume-Weighted Average Price (VWAP) across multiple timeframes on a single chart. The VWAP is a popular technical analysis tool used by traders to determine the average price of an asset weighted by volume. It helps identify the overall market trend and is especially useful for intraday trading.
Key Features:
Multiple Timeframes: Choose from 1-minute, 5-minute, 15-minute, 30-minute, 1-hour, and 1-day VWAPs. You can enable or disable the VWAP for any timeframe based on your preference.
Customizable: Easily toggle on/off the VWAP for each timeframe via checkboxes in the settings.
Price Above VWAP Marker: A clear green up arrow is displayed above the price bar whenever the price is above the current VWAP, helping you quickly spot potential bullish signals.
Flexible & Easy to Use: Adjust the settings for any timeframe and see the VWAPs on your chart without clutter. Whether you are trading in the short term or analyzing longer-term trends, this tool provides you with the flexibility you need.
How to Use:
VWAP as Trend Indicator: The VWAP is commonly used to identify whether the price is trending above or below the average price for the session. Price above the VWAP generally signals bullish momentum, while price below the VWAP can indicate bearish pressure.
Price Above VWAP Marker: The green up arrow is your signal for when the price is above the VWAP, which can be used as a potential entry point for long trades.
Customize Timeframes: Whether you're focusing on ultra-short-term movements (like 1-min or 5-min) or need a broader view (like 1-hour or 1-day), this indicator lets you tailor the analysis to your preferred time horizon.
Ideal For:
Intraday Traders looking for quick signals on different timeframes.
Swing Traders who want to track the overall market trend with multiple VWAP levels.
Scalpers needing to monitor fast price movements alongside volume-weighted averages
Script de código abierto
Fiel al espíritu de TradingView, el creador de este script lo ha convertido en código abierto, para que los traders puedan revisar y verificar su funcionalidad. ¡Enhorabuena al autor! Aunque puede utilizarlo de forma gratuita, recuerde que la republicación del código está sujeta a nuestras Normas internas.
Exención de responsabilidad
La información y las publicaciones no constituyen, ni deben considerarse como asesoramiento o recomendaciones financieras, de inversión, de trading o de otro tipo proporcionadas o respaldadas por TradingView. Más información en Condiciones de uso.