OPEN-SOURCE SCRIPT
RSI Simple and Smooth
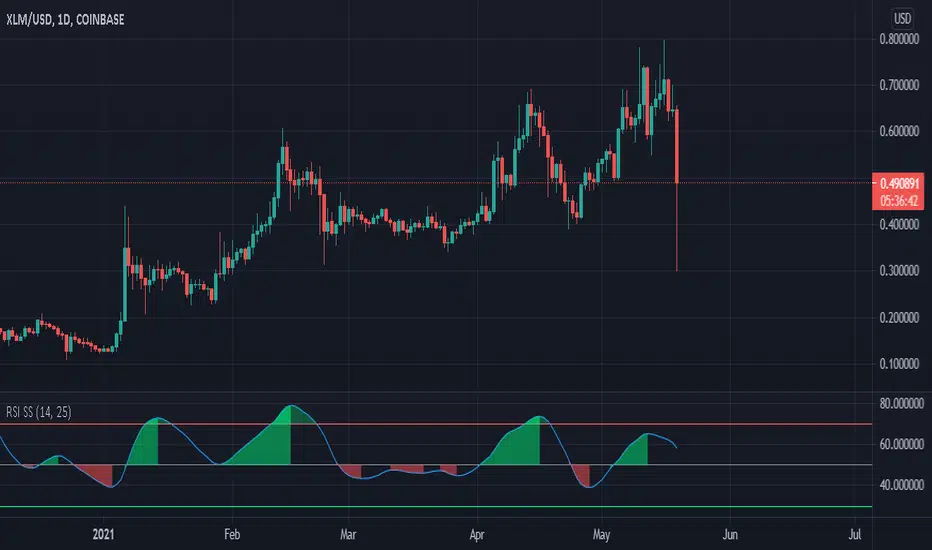
made this RSI for beginners who are annoyed by the jittery signals. Uses a HMA to smooth out the data. I made oversold line green and overbought line red where as the oscillator is green above 50 and red when below 50. This is done intentionally. This is to help remind the user that while there is a downtrend, there is a buy opportunity, and while there is a buy opportunity - there is a downtrend
On the other side, the red overbought line is to remind the user that while there is an uptrend, there is a sell opportunity, and while there is a sell opportunity - there is an uptrend :)
On the other side, the red overbought line is to remind the user that while there is an uptrend, there is a sell opportunity, and while there is a sell opportunity - there is an uptrend :)
Script de código abierto
Fiel al espíritu de TradingView, el creador de este script lo ha convertido en código abierto, para que los traders puedan revisar y verificar su funcionalidad. ¡Enhorabuena al autor! Aunque puede utilizarlo de forma gratuita, recuerde que la republicación del código está sujeta a nuestras Normas internas.
Exención de responsabilidad
La información y las publicaciones no constituyen, ni deben considerarse como asesoramiento o recomendaciones financieras, de inversión, de trading o de otro tipo proporcionadas o respaldadas por TradingView. Más información en Condiciones de uso.