OPEN-SOURCE SCRIPT
RSI with plot lines
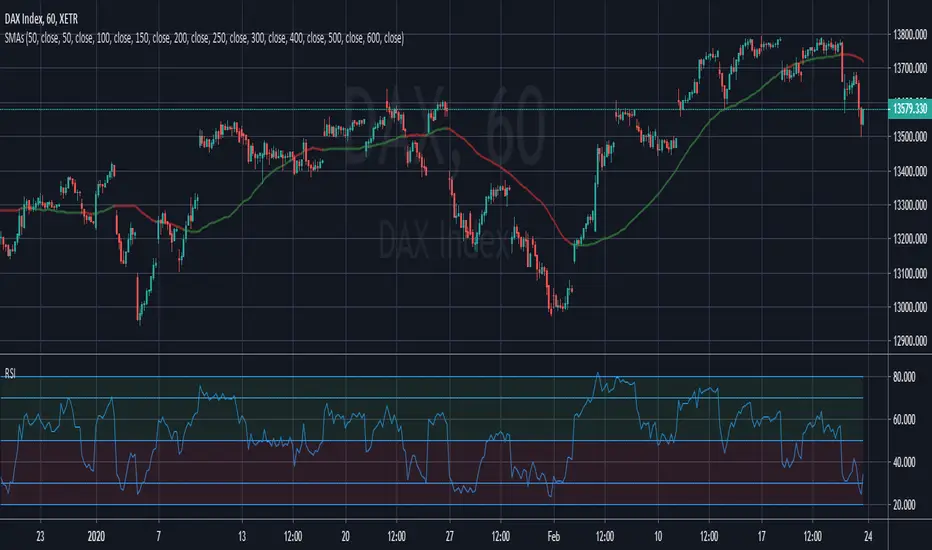
This is my first script it's pretty simple, the plots are as follows:
80 = Sell
70 = Pending sell
50 = Pullback / Retest
30 = Pending buy
20 = Buy
I would add the text to the plot lines but not sure how, if anyone has away. Please comment and I'll update.
80 = Sell
70 = Pending sell
50 = Pullback / Retest
30 = Pending buy
20 = Buy
I would add the text to the plot lines but not sure how, if anyone has away. Please comment and I'll update.
Script de código abierto
Fiel al espíritu de TradingView, el creador de este script lo ha convertido en código abierto, para que los traders puedan revisar y verificar su funcionalidad. ¡Enhorabuena al autor! Aunque puede utilizarlo de forma gratuita, recuerde que la republicación del código está sujeta a nuestras Normas internas.
Exención de responsabilidad
La información y las publicaciones no constituyen, ni deben considerarse como asesoramiento o recomendaciones financieras, de inversión, de trading o de otro tipo proporcionadas o respaldadas por TradingView. Más información en Condiciones de uso.