OPEN-SOURCE SCRIPT
Actualizado ACTION Locator
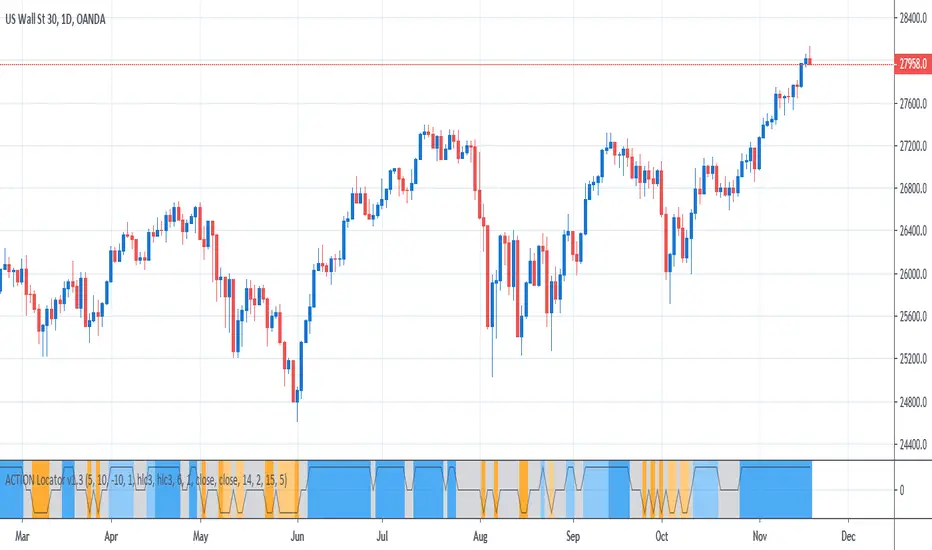
The indicator is based on the RSI and the Absolute Strength Histogram (more specifically the modification by Jie).
It is meant to be used to filter out periods of consolidation, and determine if the bulls or bears are in control when there is enough action to possibly start a trend.
The RSI is not used to find overbought or oversold conditions, but to find momentum and filter out sideways movement.
The ASH is used to filter out sideways movement by looking at the difference between the bulls and the bears and when the difference is below either the bulls or the bears, the market is considered to be consolidating. Otherwise, direction for possible trends are determined by which line is above the other.
Blue background = Bulls are in control of the ACTION
Orange background = Bears are in control of the ACTION
Gray background = No ACTION - DO NOT TRADE
Notas de prensa
Version 1.1- Added bypass options for the RSI, the ASH and the F**k U Candle ATR filter.
- The upper and lower thresholds for the RSI work for quantized RSI values now as well.
Notas de prensa
- Version 1.2 -- Added Signal Reliability Filter.
- If turned on, it detects a max amount of signal changes in a lookback period to see if we can continue to rely on the signals. If more signal changes happen than we allow, it turns the color transparent, to warn about weak signals being produced. One could choose to either stay away from trading until the color turns solid again, or trade at half the risk.
- Changed ASH to bypassed by default as the main thing is the RSI anyway.
- Changed default settings to Quantized values for the RSI and Heikin Ashi as input, as well as the period to use for the RSI to 5. It has proven more reliable.
Notas de prensa
Version 1.3- Fixed a bug that made bypassing the RSI impossible.
Script de código abierto
Fiel al espíritu de TradingView, el creador de este script lo ha convertido en código abierto, para que los traders puedan revisar y verificar su funcionalidad. ¡Enhorabuena al autor! Aunque puede utilizarlo de forma gratuita, recuerde que la republicación del código está sujeta a nuestras Normas internas.
Exención de responsabilidad
La información y las publicaciones no constituyen, ni deben considerarse como asesoramiento o recomendaciones financieras, de inversión, de trading o de otro tipo proporcionadas o respaldadas por TradingView. Más información en Condiciones de uso.