OPEN-SOURCE SCRIPT
Actualizado Multi Time Frame EMA Signal & Resistance
Full code and description: github.com/samgozman/MTF-EMA-Signal-and-Resistance
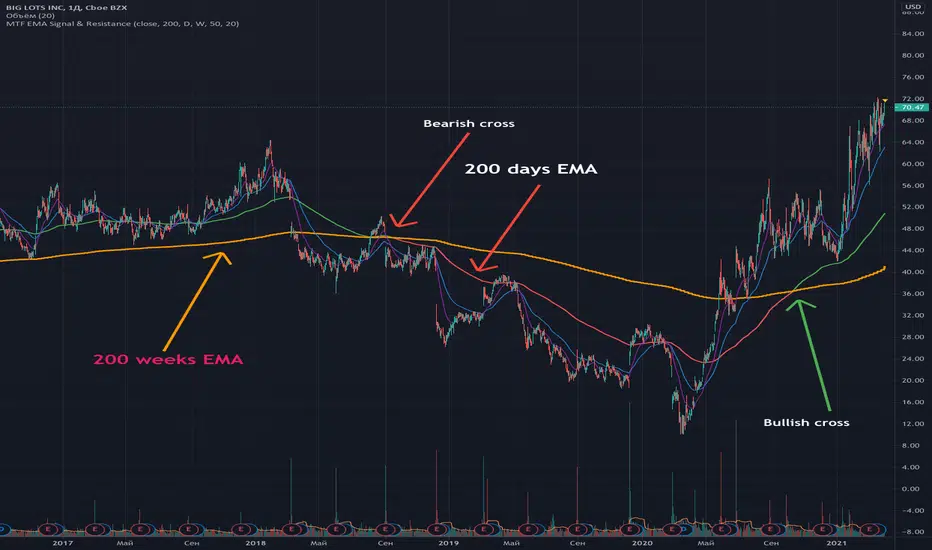
The idea of this script is quite simple. Imagine that you have a 200-day EMA and its support or resistance line is the 200-week EMA.
Then if EMA 200 1D > EMA 200 1W then the trend is bullish.
That is, EMA 200 1D is the signal line, and EMA 200 1W is the resistance.
Of course, you can independently set the time interval for the signal line and resistance, as well as the number of periods.
In addition to setting time intervals and period lengths, you can optionally enable the display of additional class EMAs.
You can also set the timeframe for the signal line equal to the current time period.
Notas de prensa
Chart updateScript de código abierto
Fiel al espíritu de TradingView, el creador de este script lo ha convertido en código abierto, para que los traders puedan revisar y verificar su funcionalidad. ¡Enhorabuena al autor! Aunque puede utilizarlo de forma gratuita, recuerde que la republicación del código está sujeta a nuestras Normas internas.
Exención de responsabilidad
La información y las publicaciones no constituyen, ni deben considerarse como asesoramiento o recomendaciones financieras, de inversión, de trading o de otro tipo proporcionadas o respaldadas por TradingView. Más información en Condiciones de uso.
Script de código abierto
Fiel al espíritu de TradingView, el creador de este script lo ha convertido en código abierto, para que los traders puedan revisar y verificar su funcionalidad. ¡Enhorabuena al autor! Aunque puede utilizarlo de forma gratuita, recuerde que la republicación del código está sujeta a nuestras Normas internas.
Exención de responsabilidad
La información y las publicaciones no constituyen, ni deben considerarse como asesoramiento o recomendaciones financieras, de inversión, de trading o de otro tipo proporcionadas o respaldadas por TradingView. Más información en Condiciones de uso.