OPEN-SOURCE SCRIPT
Actualizado Key Points of Adjoining Median (KPAM)
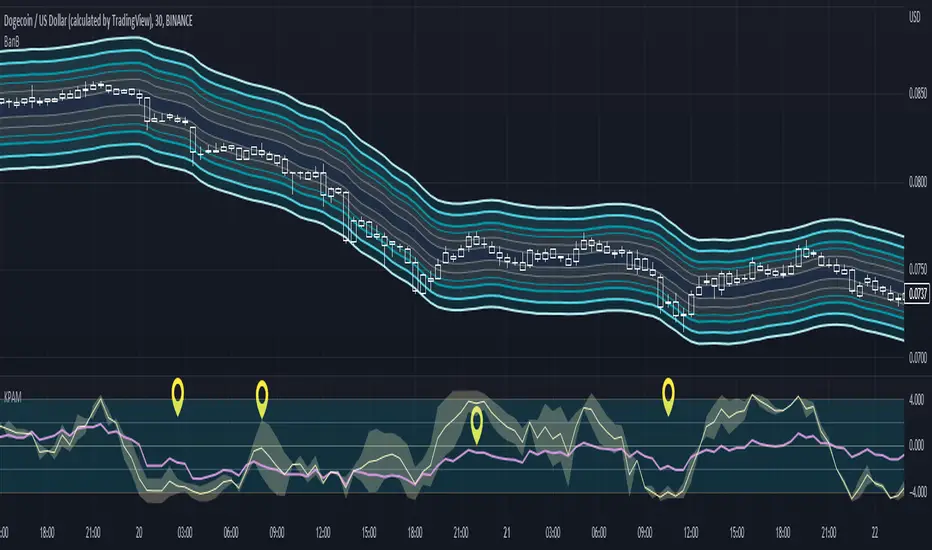
This indicator shows more reliable overbought & oversold levels buy combing 3 different level-indicators (i.e., indicators showing overbought/oversold levels).
A median is created by adjoining two of them and then it is assisted by a third one.
This reduces noise in calculating entries when using level indicators.
Note: The extra indicator shown is "Bands Bands (BanB)"
----- HOW TO USE IT -----
Use with price-action trading and with indicators showing the overall trend.
See notes in chart for more explanation.
The high and low levels of the RSI are within a range of 2 & -2 respectively.
The high and low levels for the median range from 4 & -4 respectively.
The Discordance shows how certain the level of the median is.
For example, if a part of the Discordance touches a low level while the median is at a higher level, then it usually indicates that the median is about to reverse.
The more Discordance that is visible, the less certain the current trend of the median is.
----- HOW THIS INDICATOR IS ORIGINAL; WHAT IT DOES AND HOW IT DOES IT -----
This indicator has an original, unique ability to reduce noise when comparing overbought and oversold levels.
It does this by first adjoining the Stochastic and the Stochastic RSI. Second, it creates a median from the two.
Third, the median is compared to the RSI on the same scale to assist in deciding where the median is at in relation to itself.
It shows whether the median lows and highs are near overbought or oversold levels.
----- VERSION -----
This is not a variant of the Stochastic, Stochastic RSI, and/or the RSI.
The focus is on the median that is created by an adjoining of the Stochastic and Stochastic RSI.
The Stochastic and Stochastic RSI are needed in order to obtain and plot the Median and the Discordance.
The RSI is plotted on the same scale to serve as the comparison needed to evaluate the Median levels with more visual accuracy.
Notas de prensa
Added additional customization options for more visual clarity.Notas de prensa
Added an EMA of the KPAM.Script de código abierto
Fiel al espíritu de TradingView, el creador de este script lo ha convertido en código abierto, para que los traders puedan revisar y verificar su funcionalidad. ¡Enhorabuena al autor! Aunque puede utilizarlo de forma gratuita, recuerde que la republicación del código está sujeta a nuestras Normas internas.
Exención de responsabilidad
La información y las publicaciones no constituyen, ni deben considerarse como asesoramiento o recomendaciones financieras, de inversión, de trading o de otro tipo proporcionadas o respaldadas por TradingView. Más información en Condiciones de uso.
Script de código abierto
Fiel al espíritu de TradingView, el creador de este script lo ha convertido en código abierto, para que los traders puedan revisar y verificar su funcionalidad. ¡Enhorabuena al autor! Aunque puede utilizarlo de forma gratuita, recuerde que la republicación del código está sujeta a nuestras Normas internas.
Exención de responsabilidad
La información y las publicaciones no constituyen, ni deben considerarse como asesoramiento o recomendaciones financieras, de inversión, de trading o de otro tipo proporcionadas o respaldadas por TradingView. Más información en Condiciones de uso.