PROTECTED SOURCE SCRIPT
M2 + Fed Funds con anotaciones históricas
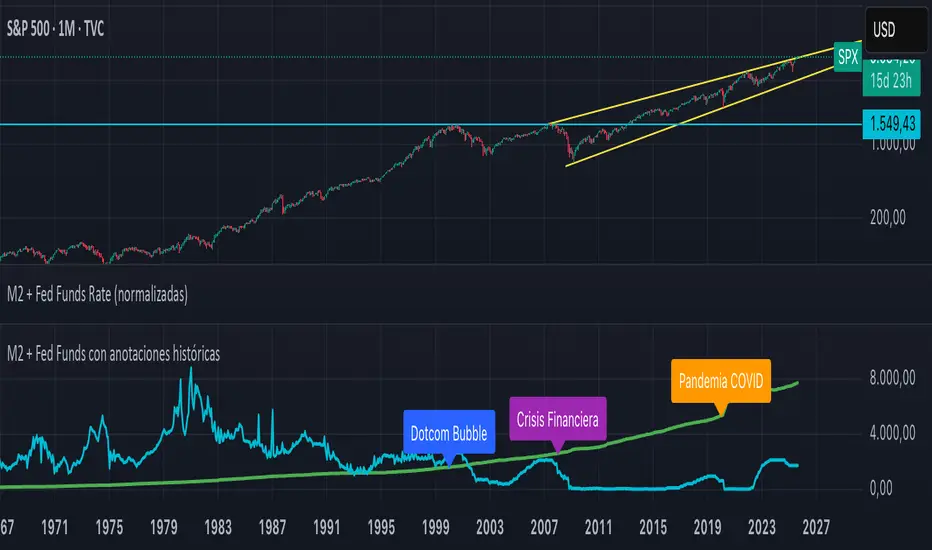
This TradingView indicator creates a separate panel that displays the historical evolution of M2 Money Stock (US) and the Federal Funds Rate, both normalized to a base of 100 for easier comparison. It highlights key historical events with annotations, including:
2000: Dotcom Bubble
2008: Global Financial Crisis
2020: COVID-19 Pandemic
The script allows users to visually analyze the relationship between monetary liquidity (M2) and interest rates, showing how changes in Fed policy correspond to major economic events and trends.
2000: Dotcom Bubble
2008: Global Financial Crisis
2020: COVID-19 Pandemic
The script allows users to visually analyze the relationship between monetary liquidity (M2) and interest rates, showing how changes in Fed policy correspond to major economic events and trends.
Script protegido
Este script se publica como código cerrado. No obstante, puede utilizarlo libremente y sin ninguna limitación. Obtenga más información aquí.
Exención de responsabilidad
La información y las publicaciones no constituyen, ni deben considerarse como asesoramiento o recomendaciones financieras, de inversión, de trading o de otro tipo proporcionadas o respaldadas por TradingView. Más información en Condiciones de uso.