PROTECTED SOURCE SCRIPT
Actualizado Daily ATR Levels - Vishal Subandh

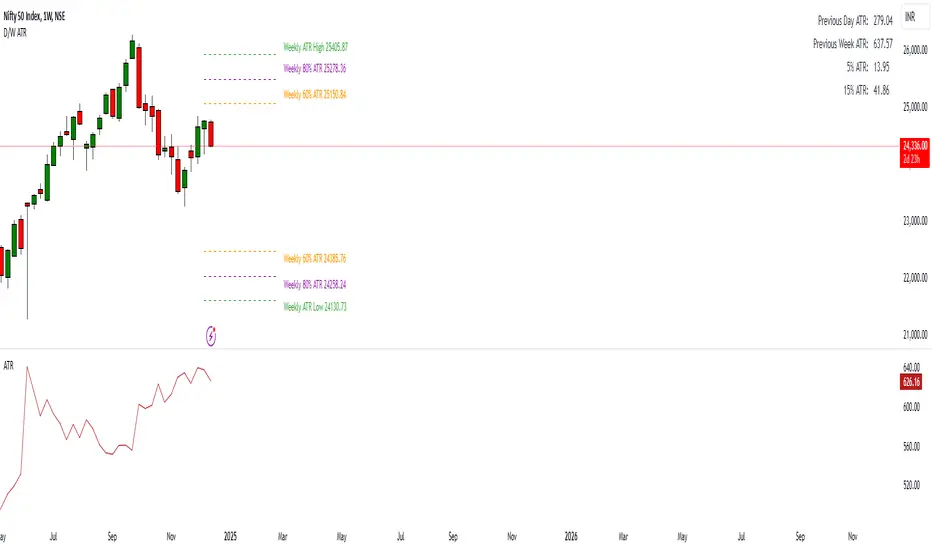
The following script visualizes the ATR High and ATR Low levels based on the previous day’s closing price. The Average True Range (ATR) indicates how much a stock is likely to move—upward or downward—on a given day, providing insight into its intraday volatility. Additionally, the script calculates and displays the daily ATR as a percentage, with specific levels marked at 60% and 80%.
These percentage levels are plotted for both the high and low ranges, offering a framework to analyze potential price movements. In the context of a strong trend, prices often extend to the 80% or even 100% ATR level before showing signs of reversal. Such behavior is observed during pronounced uptrends or downtrends. Conversely, during weaker trends, price reversals may occur at the 60% ATR levels.
It is recommended to use this analysis in conjunction with other tools, such as support and resistance levels or demand and supply zones, for a more comprehensive approach to trading.
Notas de prensa
Added an option where the user can use 2 decimal places or 4 decimal places to see the values for forex marketsNotas de prensa
Added Weekly ATR levels for swing trading. The study will now allow the trader to view either Daily levels, Weekly Levels, or both on the charts. Using this the trader can look for a confluence of the daily and weekly levels in conjunction with support and resistance or demand and supplyScript protegido
Este script se publica como código cerrado. No obstante, puede utilizarlo libremente y sin ninguna limitación. Obtenga más información aquí.
Exención de responsabilidad
La información y las publicaciones no constituyen, ni deben considerarse como asesoramiento o recomendaciones financieras, de inversión, de trading o de otro tipo proporcionadas o respaldadas por TradingView. Más información en Condiciones de uso.
Script protegido
Este script se publica como código cerrado. No obstante, puede utilizarlo libremente y sin ninguna limitación. Obtenga más información aquí.
Exención de responsabilidad
La información y las publicaciones no constituyen, ni deben considerarse como asesoramiento o recomendaciones financieras, de inversión, de trading o de otro tipo proporcionadas o respaldadas por TradingView. Más información en Condiciones de uso.