OPEN-SOURCE SCRIPT
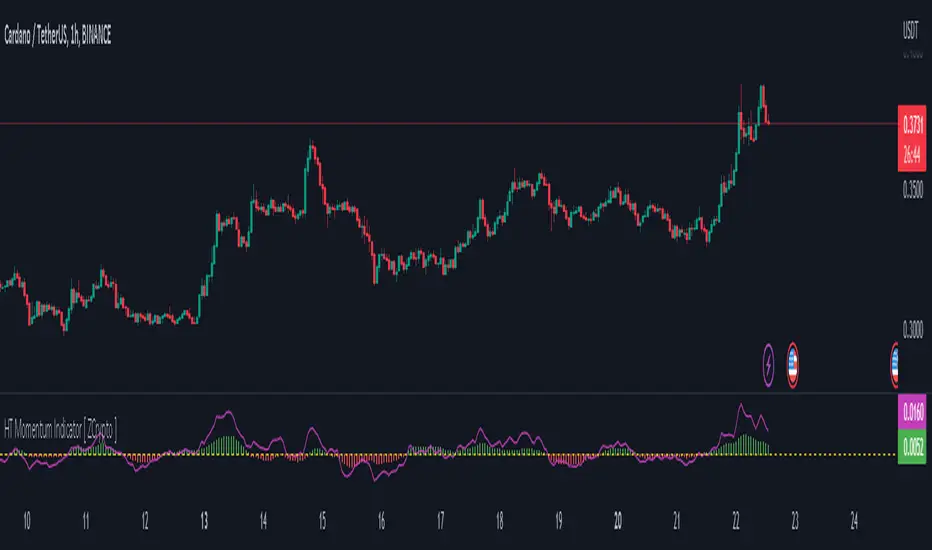
HT Momentum Indicator [ ZCrypto ]

The HT Momentum Indicator is a technical analysis tool that uses the Hyperbolic Tangent (tanh) function to measure momentum in a trading instrument.
This indicator is plotted as a histogram, with positive values indicating bullish momentum and negative values indicating bearish momentum.
Here are the main features and settings of the HT Momentum Indicator:
Source: This setting allows you to choose the price data used to calculate the momentum indicator. By default, the indicator uses the (High+Low+Close)/3 price, but you can select other options such as the open, high, or low prices.
Period: This setting determines the number of periods used in the momentum calculation. By default, the indicator uses a period of 14, but you can adjust this to suit your trading style and the market you are trading.
Show Fast/Slow/VWAP: These settings allow you to choose whether or not to display the fast and slow exponential moving averages (EMAs) and the volume-weighted average price (VWAP) on the chart.
Fast Length/Slow Length/VWAP Length: These settings allow you to adjust the length of the fast and slow EMAs and the VWAP calculation.
Bull Color/Bear Color: These settings allow you to choose the colors for the bullish and bearish histograms.
Zero Line: This indicator also includes a horizontal line at the zero level to help you identify when momentum is transitioning from bullish to bearish or vice versa.
The HT Momentum Indicator can be used to identify trends, momentum shifts, and potential buy/sell signals.
you can use the fast and slow EMAs to identify short-term and long-term trends, respectively, and the VWAP to gauge the strength of buying or selling pressure.
Additionally, the HT Momentum Indicator includes four pre-programmed alert conditions, which can notify you
- when the fast EMA crosses above the slow EMA,
- when the VWAP crosses above the zero line,
- when the histogram transitions from negative to positive values.
- when the histogram transitions from negative to positive values and VWAP above zero line
Script de código abierto
Fiel al espíritu de TradingView, el creador de este script lo ha convertido en código abierto, para que los traders puedan revisar y verificar su funcionalidad. ¡Enhorabuena al autor! Aunque puede utilizarlo de forma gratuita, recuerde que la republicación del código está sujeta a nuestras Normas internas.
Links : linktr.ee/tzacks
Exención de responsabilidad
La información y las publicaciones no constituyen, ni deben considerarse como asesoramiento o recomendaciones financieras, de inversión, de trading o de otro tipo proporcionadas o respaldadas por TradingView. Más información en Condiciones de uso.