OPEN-SOURCE SCRIPT
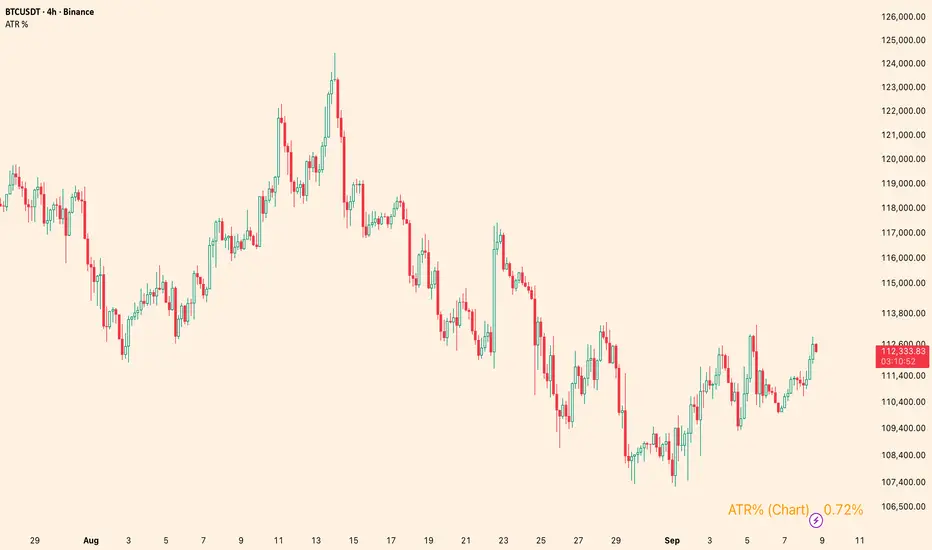
ATR %
Overview
Shows the Average True Range (ATR) as a percentage of a chosen price basis. Useful for a quick, apples-to-apples view of current volatility across symbols and timeframes. The value is displayed in a clean table at the bottom-right of the chart.
What it shows
Inputs
Notes
Use cases
Disclaimer
For educational purposes only. Not financial advice. Trading involves risk.
Shows the Average True Range (ATR) as a percentage of a chosen price basis. Useful for a quick, apples-to-apples view of current volatility across symbols and timeframes. The value is displayed in a clean table at the bottom-right of the chart.
What it shows
- Basis can be: Close, EMA(len), SMA(len), or VWAP.
- Data timeframe can be the Chart timeframe or a Daily aggregation.
Inputs
- ATR length (len) – ATR lookback.
- Percent basis – Close / EMA / SMA / VWAP.
- Data timeframe – Chart (uses the current chart TF) or Daily (computes ATR and basis from daily data).
- Decimals – number of decimal places to display.
- Text / Background / Frame colors – customize the table appearance.
Notes
- In Daily mode, ATR and basis are taken from daily data and update on daily close.
- VWAP is available only in Chart mode (Daily + VWAP will show n/a by design).
- The script overlays the chart but does not plot lines—only a compact info box.
Use cases
- Compare volatility across coins/stocks quickly using ATR% instead of raw ATR.
- Switch basis to match your style (e.g., EMA for trend-aware scaling, VWAP for intraday context).
- Set Daily to track higher-timeframe volatility while trading lower TFs.
Disclaimer
For educational purposes only. Not financial advice. Trading involves risk.
Script de código abierto
Fiel al espíritu de TradingView, el creador de este script lo ha convertido en código abierto, para que los traders puedan revisar y verificar su funcionalidad. ¡Enhorabuena al autor! Aunque puede utilizarlo de forma gratuita, recuerde que la republicación del código está sujeta a nuestras Normas internas.
✅My Telegram
t.me/charyyevn
t.me/charyyevn
Exención de responsabilidad
La información y las publicaciones no constituyen, ni deben considerarse como asesoramiento o recomendaciones financieras, de inversión, de trading o de otro tipo proporcionadas o respaldadas por TradingView. Más información en Condiciones de uso.