Bravo Essentials
The Normalized Volume and Volatility Frequency Profile
This is a specialized analytical indicator that integrates volatility-adjusted volume data with a price frequency distribution profile. It provides a multidimensional perspective of how trading activity and volatility interact across different price levels, allowing for a deeper understanding of where market participation is most concentrated and how price dynamics evolve over time.
Unlike traditional volume or profile indicators that treat volume and volatility separately, this tool adjusts volume relative to volatility, creating a more balanced and context-aware representation of market behavior. This helps traders observe how changes in volatility influence participation, and where stable or reactive zones tend to form in the price structure.
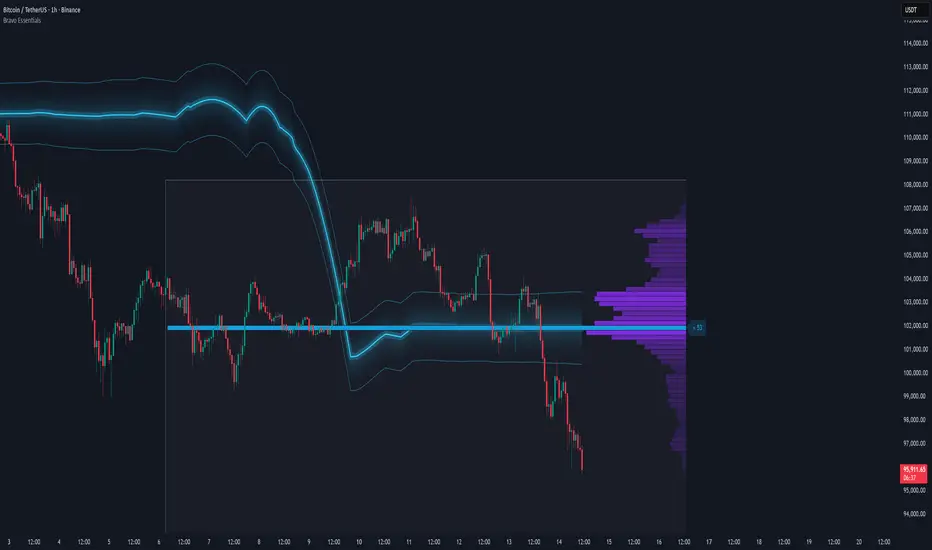
The indicator displays a visual box made up of two main components:
Normalized Volume with Volatility Adjustment, displayed at the bottom, showing how trading activity responds to varying levels of volatility.
Price Frequency Profile — positioned on the right side, mapping how often price has traded at each level and highlighting the Point of Control (POC), the area of highest activity or equilibrium.
Key Features
- Normalized Volume & Volatility Display
Illustrates trading activity in context with volatility changes, revealing periods of expansion and contraction that may not appear on raw volume charts.
- Frequency Distribution Profile
Displays the density of price interactions across the selected range, helping highlight zones where the market has spent the most time.
- Point of Control (POC)
Marks the level with the highest concentration of price activity, often an area of balance or a potential inflection point.
- Adaptive Scaling
Automatically adjusts to market conditions, ensuring consistent readability during both high and low volatility periods.
- Gradient Visualization
Uses color intensity to convey the strength of both volume and frequency data, aiding quick interpretation.
- Customizable Parameters
Includes options to modify lookback length, bin count, and color palette to suit different charting preferences.
How to Use
- Volume and Volatility Context
Detect transitions between low-activity consolidation and high-activity breakout conditions by comparing normalized volume behavior with price movement.
- Market Structure Analysis
Identify areas of balance and imbalance within the price range, offering potential support and resistance cues.
- Trend Assessment
Analyze the relationship between rising or falling normalized volume and directional price changes to evaluate momentum consistency.
- Breakout Confirmation
Observe how price behaves around the POC; a breakout with increasing normalized volume can reinforce directional conviction.
Pre-Move Compression Zones
Recognize low-volatility regions that often precede significant directional expansions.
The Dynamic POC
The Dynamic Point of Control (Dynamic POC) is a price based key level that continuously adapts to evolving market conditions. It represents the price area where the most trading activity or volume concentration has occurred within a defined lookback period. This level effectively marks the market’s short-term “center of gravity,” providing valuable insight into areas of balance, interest, and potential reaction.
Unlike static profile based POC levels that are calculated once and remain fixed, the Dynamic POC recalculates in real time as new data forms. This makes it more responsive to intraday structure and better suited for active trading environments where market balance can shift quickly. The inclusion of volatility-based upper and lower bands adds further context, helping traders assess how far price has deviated from equilibrium and whether current movement is expanding or reverting toward balance.
Key Features
- Adaptive Price Equilibrium
Continuously tracks the most active price zone within a rolling window, updating dynamically as market conditions evolve.
- Volume-Weighted Logic
Reflects where the greatest market participation occurs, highlighting levels where buyers and sellers have historically agreed on value.
- Volatility Bands
Optional upper and lower boundaries expand and contract based on market volatility, visually defining zones of potential overextension or compression.
- Color-Coded Visualization
Uses clear, consistent coloring to distinguish the POC line and its volatility envelopes, making it easy to interpret balance shifts at a glance.
- Customizable Width and Lookback
Adjustable parameters allow traders to fine-tune sensitivity and precision depending on the timeframe or strategy focus.
How to Use
- Market Balance Indicator
When price remains close to the Dynamic POC, it suggests equilibrium—markets are balanced and consolidating.
- Directional Bias Filter
Sustained movement above the Dynamic POC often reflects bullish control, while persistent price action below can indicate bearish sentiment.
- Reversion & Breakout Context
Tests of the upper or lower volatility bands can precede mean reversion toward the POC, while clean breaks beyond them may confirm continuation momentum.
- Support and Resistance Framework
The Dynamic POC frequently aligns with short-term support or resistance zones, making it a useful anchor for trade entries, targets, and risk placement.
By combining both the POC and the Volume Frequency Profile we are able to build up a system of confluence whereby we can locate pockets of larger volume in the market. Generally speaking these are good areas to be setting areas for entries, exits and stop losses.
Script que requiere invitación
Solo los usuarios autorizados por el autor pueden acceder a este script. Deberá solicitar y obtener permiso para utilizarlo. Por lo general, este se concede tras realizar el pago. Para obtener más información, siga las instrucciones del autor indicadas a continuación o póngase en contacto directamente con ChartPrime.
TradingView NO recomienda pagar por un script ni utilizarlo a menos que confíe plenamente en su autor y comprenda cómo funciona. También puede encontrar alternativas gratuitas y de código abierto en nuestros scripts de la comunidad.
Instrucciones del autor
Exención de responsabilidad
Script que requiere invitación
Solo los usuarios autorizados por el autor pueden acceder a este script. Deberá solicitar y obtener permiso para utilizarlo. Por lo general, este se concede tras realizar el pago. Para obtener más información, siga las instrucciones del autor indicadas a continuación o póngase en contacto directamente con ChartPrime.
TradingView NO recomienda pagar por un script ni utilizarlo a menos que confíe plenamente en su autor y comprenda cómo funciona. También puede encontrar alternativas gratuitas y de código abierto en nuestros scripts de la comunidad.