OPEN-SOURCE SCRIPT
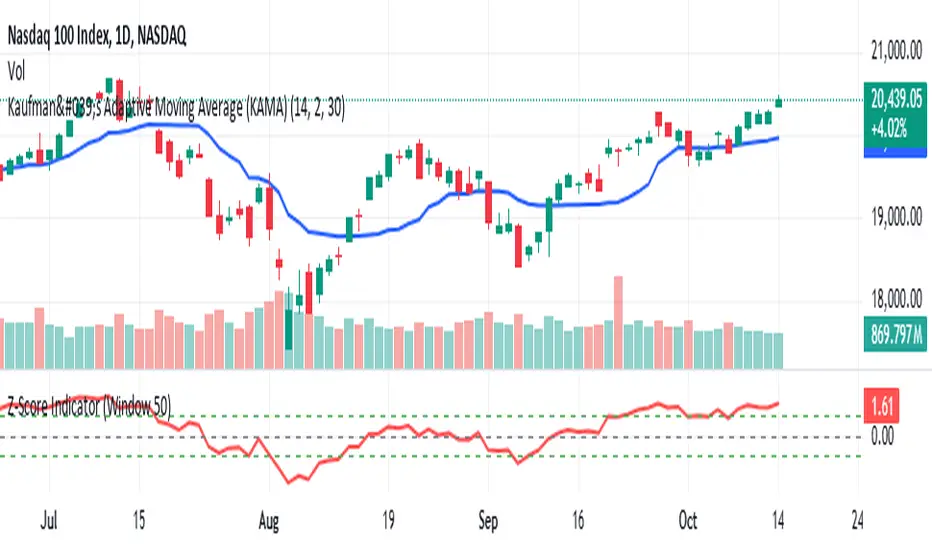
Kaufman's Adaptive Moving Average (KAMA)

Another simple easy to use indicator that incorporates mean reversion and trend following.
Kaufman's Adaptive Moving Average (KAMA) is an indicator developed by Perry Kaufman that adjusts its sensitivity based on market volatility. It is designed to react more quickly during trending markets and slow down in sideways or volatile markets. The primary idea is that in a trending market, the moving average should be more sensitive to price changes, while in a non-trending market, it should be less responsive to noise.
KAMA Formula
The formula for the Kaufman Adaptive Moving Average is:
Efficiency Ratio (ER): Measures the efficiency of price movement over a given period.
ER
=
Smoothing Factor
Volatility
=
Sum of absolute price change
Sum of absolute price movement
ER=
Volatility
Smoothing Factor
=
Sum of absolute price movement
Sum of absolute price change
The Efficiency Ratio is calculated by taking the price change over a defined period and dividing it by the total price movement (which is the sum of absolute price changes).
Smoothing Constant (SC): This is a factor used to adjust the moving average's responsiveness:
SC
=
ER
×
(
2
/
(
𝑛
+
1
)
)
+
(
1
−
ER
)
×
(
2
/
(
𝑛
+
1
)
)
SC=ER×(2/(n+1))+(1−ER)×(2/(n+1))
where n is the length of the moving average period.
Steps to Calculate KAMA:
Efficiency Ratio (ER):
Calculate the sum of absolute price changes over the chosen period.
Calculate the sum of absolute price movements over the same period.
Smoothing Constant (SC):
Use the Efficiency Ratio to adjust the smoothing factor.
KAMA Calculation:
The initial KAMA is the simple moving average (SMA) of the first n periods.
For subsequent periods, KAMA is calculated using a formula based on the smoothing constant and previous KAMA values.
experiment with the variables as you like!!
Script de código abierto
Fiel al espíritu de TradingView, el creador de este script lo ha convertido en código abierto, para que los traders puedan revisar y verificar su funcionalidad. ¡Enhorabuena al autor! Aunque puede utilizarlo de forma gratuita, recuerde que la republicación del código está sujeta a nuestras Normas internas.
Exención de responsabilidad
La información y las publicaciones no constituyen, ni deben considerarse como asesoramiento o recomendaciones financieras, de inversión, de trading o de otro tipo proporcionadas o respaldadas por TradingView. Más información en Condiciones de uso.