OPEN-SOURCE SCRIPT
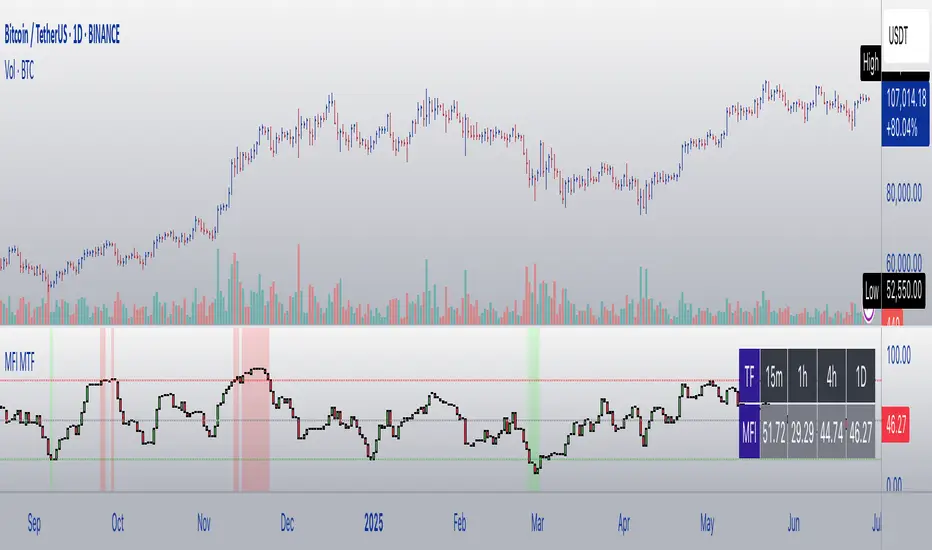
MFI Candles MTF Table

MFI Candles + Multi-Timeframe Table | by julzALGO
This open-source script visualizes the Money Flow Index (MFI) in a new format — as candles instead of a traditional oscillator line. It provides a clean, volume-driven view of momentum and pressure, ideal for traders seeking more actionable and visual cues than a typical MFI plot.
What Makes It Unique:
• Plots "MFI Candles" — synthetic candles based on smoothed MFI values using a selected timeframe (default: 1D), giving a new way to read volume flow.
• Candles reflect momentum: green if MFI rises, red if it falls.
• Background turns red when MFI is overbought (≥ 80) or green when oversold (≤ 20).
Multi-Timeframe Strength Table:
• Displays MFI values from 15m, 1h, 4h, and 1D timeframes — all in one dashboard.
• Color-coded for quick recognition: 🔴 Overbought, 🟢 Oversold.
• Values are smoothed with linear regression for better clarity.
Custom Settings:
• MFI calculation length
• Smoothing factor
• Candle source timeframe
• Toggle table and OB/OS background
How to Use:
- Use MFI Candles to monitor momentum shifts based on money flow.
- Use the Multi-Timeframe Table to identify when multiple timeframes align — helpful for timing entries and exits.
- Watch the background for extreme conditions (OB/OS) that may signal upcoming reversals or pressure exhaustion.
Happy Trading!
Script de código abierto
Fiel al espíritu de TradingView, el creador de este script lo ha convertido en código abierto, para que los traders puedan revisar y verificar su funcionalidad. ¡Enhorabuena al autor! Aunque puede utilizarlo de forma gratuita, recuerde que la republicación del código está sujeta a nuestras Normas internas.
Exención de responsabilidad
La información y las publicaciones no constituyen, ni deben considerarse como asesoramiento o recomendaciones financieras, de inversión, de trading o de otro tipo proporcionadas o respaldadas por TradingView. Más información en Condiciones de uso.