PROTECTED SOURCE SCRIPT
VIX (StevenCharts)
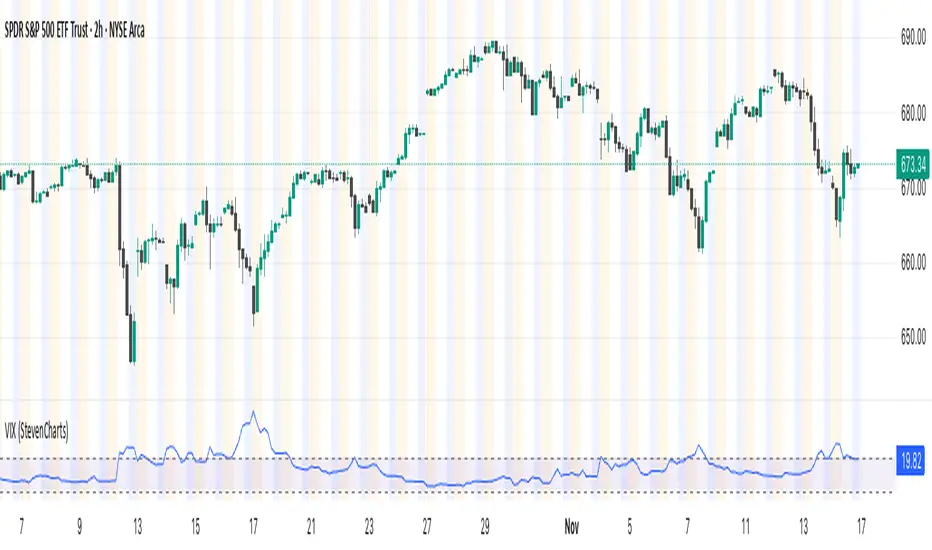
This indicator plots the VIX (CBOE Volatility Index) in a separate pane to help you quickly gauge market sentiment and volatility.
It highlights the key zone between 15 and 20, which often acts as a transition area between low and high-volatility regimes.
Features:
Plots the VIX line.
Allows you to change the color of the VIX line.
It highlights the key zone between 15 and 20, which often acts as a transition area between low and high-volatility regimes.
Features:
Plots the VIX line.
Allows you to change the color of the VIX line.
Script protegido
Este script se publica como código cerrado. No obstante, puede utilizarlo libremente y sin ninguna limitación. Obtenga más información aquí.
Exención de responsabilidad
La información y las publicaciones no constituyen, ni deben considerarse como asesoramiento o recomendaciones financieras, de inversión, de trading o de otro tipo proporcionadas o respaldadas por TradingView. Más información en Condiciones de uso.