OPEN-SOURCE SCRIPT
IV Rank/Percentile with Williams VIX Fix
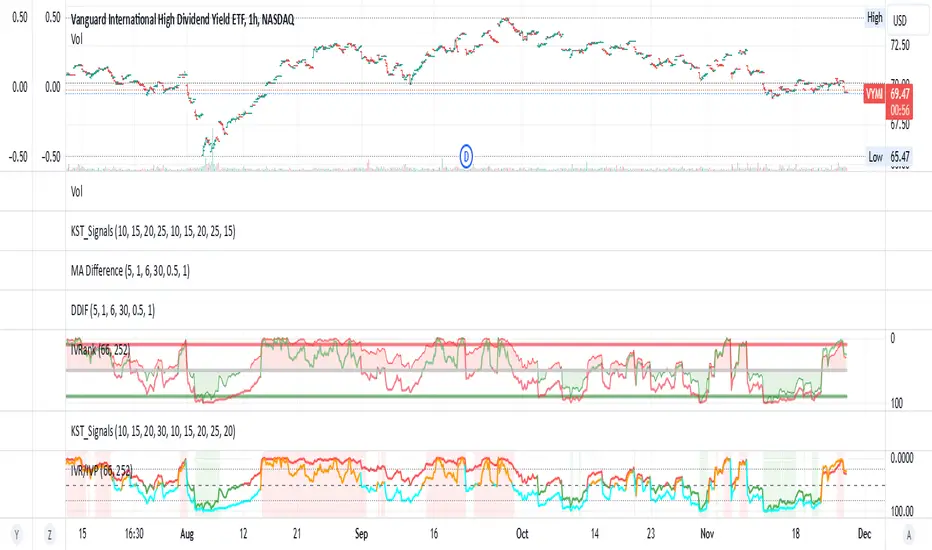
Display IV Rank / IV Percentile
This indicator is based on William's VixFix, which replicates the VIX—a measure of the implied volatility of the S&P 500 Index (SPX). The key advantage of the VixFix is that it can be applied to any security, not just the SPX.
IV Rank is calculated by identifying the highest and lowest implied volatility (IV) values over a selected number of past periods. It then determines where the current IV lies as a percentage between these two extremes. For example, if over the past five periods the highest IV was 30%, the lowest was 10%, and the current IV is 20%, the IV Rank would be 50%, since 20% is halfway between 10% and 30%.
IV Percentile, on the other hand, considers all past IV values—not just the highest and lowest—and calculates the percentage of these values that are below the current IV. For instance, if the past five IV values were 30%, 10%, 11%, 15%, and 17%, and the current IV is 20%, the IV Rank remains at 50%. However, the IV Percentile is 80% because 4 out of the 5 past values (80%) are below the current IV of 20%.
Script de código abierto
Fiel al espíritu de TradingView, el creador de este script lo ha convertido en código abierto, para que los traders puedan revisar y verificar su funcionalidad. ¡Enhorabuena al autor! Aunque puede utilizarlo de forma gratuita, recuerde que la republicación del código está sujeta a nuestras Normas internas.
Exención de responsabilidad
La información y las publicaciones no constituyen, ni deben considerarse como asesoramiento o recomendaciones financieras, de inversión, de trading o de otro tipo proporcionadas o respaldadas por TradingView. Más información en Condiciones de uso.