PROTECTED SOURCE SCRIPT
Actualizado Walter Deemer Market Breadth Breakaway Momentum
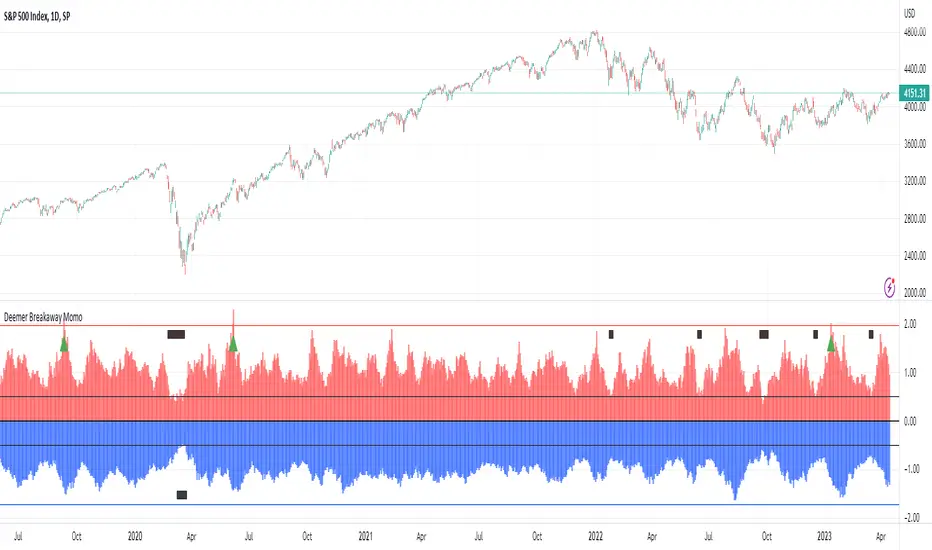
This indicator is based on long time market analysts Walter Deemer's research. Below is a summary of what the indicator is used for. In short it can be used to spot market reversals.
In short, when the 10 day NYSE Advance:Decline ratio breaches 1.97, the market has achieved break away momentum. When the 20 day ratio achieves a 1.72 ratio this can be a "good" signal even if when the 10 day has not achieved a 1.97 ratio.
In addition to the NYSE, you can toggle NASDAQ, AMEX, or the average of the three.
You can read more about it here: walterdeemer.com/bam.htm
"Downside momentum usually peaks at the end of a decline, as prices cascade into a primary low. On the upside, though, momentum peaks at the beginning of an advance, then gradually dissipates as the advance goes on, and the more powerful the momentum at the move's beginning, the stronger the overall move; REALLY strong momentum is found only at the beginning of a REALLY strong move: a new bull market or a new intermediate leg up within a bull market. We coined the term "breakaway momentum" in the 1970's to describe this REALLY powerful upside momentum. The following is a review of what it is and how it is typically generated.
Breakaway momentum (some people call it a "breadth thrust") occurs when ten-day total advances on the NYSE are greater than 1.97 times ten-day total NYSE declines. It is a relatively uncommon phenomenon...24 times it has occurred since World War II (an average of once every 3 1/2 years). Cyclical bull markets, though, are traditionally heralded by breakaway momentum, so we are hopeful that it will be generated this time around, too.
....The real trick in generating breakaway momentum? It's not a lot of advances; it's a lack of declines."
Notas de prensa
Added arrows to indicate when the 10-day and 20-day hits the thresholds.Notas de prensa
Enhanced the indicator with several improvements.- Improved the visuals of the chart.
- Added new options for selecting the source data.
- Updated the calculations to be more efficient.
- Added flags for breadth exhaustion. NOTE: This is based on my own observation and not called out by Deemer himself.
Notas de prensa
minor bug fixNotas de prensa
Fixed TypoScript protegido
Este script se publica como código cerrado. Sin embargo, puede utilizarlo libremente y sin limitaciones: obtenga más información aquí.
Exención de responsabilidad
La información y las publicaciones que ofrecemos, no implican ni constituyen un asesoramiento financiero, ni de inversión, trading o cualquier otro tipo de consejo o recomendación emitida o respaldada por TradingView. Puede obtener información adicional en las Condiciones de uso.
Script protegido
Este script se publica como código cerrado. Sin embargo, puede utilizarlo libremente y sin limitaciones: obtenga más información aquí.
Exención de responsabilidad
La información y las publicaciones que ofrecemos, no implican ni constituyen un asesoramiento financiero, ni de inversión, trading o cualquier otro tipo de consejo o recomendación emitida o respaldada por TradingView. Puede obtener información adicional en las Condiciones de uso.