OPEN-SOURCE SCRIPT
Directional ATR
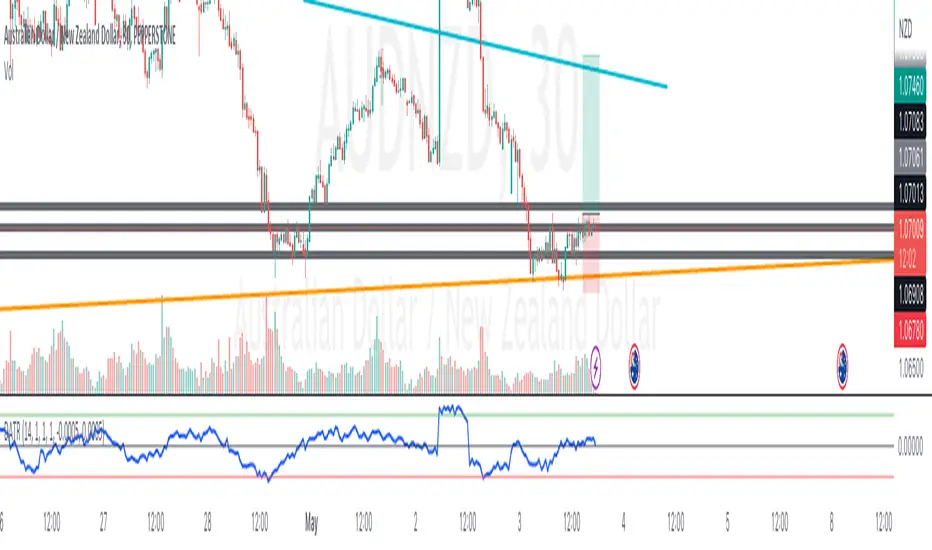
TLDR: A custom volatility indicator that combines Average True Range with candle direction.
The Directional ATR (DATR) is an indicator that enhances the traditional Average True Range (ATR) by incorporating the direction of the candle (bullish or bearish).
This indicator is designed to help traders identify trend strength, potential trend reversals, and market volatility.
Key Features:
- Trend Confirmation: Positive and increasing DATR values suggest a bullish trend, while negative and decreasing values indicate a bearish trend. A higher absolute DATR value signifies a stronger trend.
- Trend Reversal: A change in the direction of the DATR from positive to negative or vice versa may signal a potential trend reversal.
- Volatility: Like the standard ATR, the DATR can be used to gauge market volatility, with larger absolute values indicating higher volatility and smaller values suggesting lower volatility.
- Divergence: Divergence between the price and the DATR could signal a potential weakening of the trend and an upcoming reversal.
- Overbought/Oversold Levels: Extreme DATR values can be used to identify overbought or oversold market conditions, signaling potential reversals or corrections.
Please note that the Directional ATR is just an indicator, and the interpretations provided are based on its underlying logic.
It is essential to combine the DATR with other technical analysis tools and test the indicator on historical data before using it in your trading strategy. Additionally, consider other factors such as risk management, and your own trading style.
Script de código abierto
Fiel al espíritu de TradingView, el creador de este script lo ha convertido en código abierto, para que los traders puedan revisar y verificar su funcionalidad. ¡Enhorabuena al autor! Aunque puede utilizarlo de forma gratuita, recuerde que la republicación del código está sujeta a nuestras Normas internas.
Exención de responsabilidad
La información y las publicaciones no constituyen, ni deben considerarse como asesoramiento o recomendaciones financieras, de inversión, de trading o de otro tipo proporcionadas o respaldadas por TradingView. Más información en Condiciones de uso.