OPEN-SOURCE SCRIPT
Korean Exchange Relative Volume Barchart
Korean Exchange Relative Volume Barchart
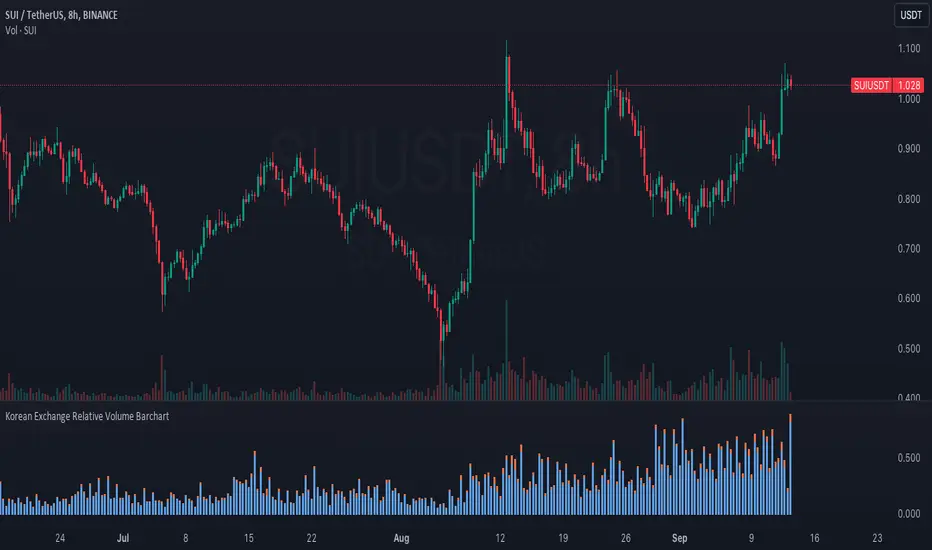
The Korean Exchange Relative Volume Barchart indicator compares the trading volume of a cryptocurrency on any symbol with the combined volumes of major Korean exchanges, Upbit and Bithumb. This tool helps traders understand regional trading activities, offering insights into market sentiment influenced by Korean markets.
For example 0.5 would indicate that the Korean exchanges are doing 50% of the volume of the selected symbol.
Features:
Usage:
Notes:
Enhance your trading analysis by understanding the influence of Korean exchanges on cryptocurrency volumes with the Korean Exchange Volume Comparison indicator.
The Korean Exchange Relative Volume Barchart indicator compares the trading volume of a cryptocurrency on any symbol with the combined volumes of major Korean exchanges, Upbit and Bithumb. This tool helps traders understand regional trading activities, offering insights into market sentiment influenced by Korean markets.
For example 0.5 would indicate that the Korean exchanges are doing 50% of the volume of the selected symbol.
Features:
- Exchange Selection: Include or exclude Upbit and Bithumb in the comparison.
- Automatic Symbol Mapping: Automatically maps the current chart's symbol to equivalent symbols on Upbit and Bithumb.
- Stacked Bar Chart Visualization: Plots a stacked bar chart showing the relative volume contributions of Binance, Upbit, and Bithumb.
Usage:
- Add the Indicator: Apply it to a cryptocurrency chart on TradingView.
- Configure Settings: Toggle inclusion of Upbit and Bithumb in the settings.
- Interpret the Chart: The stacked bar chart displays the proportion of trading volumes from each exchange.
Notes:
- Symbol Compatibility: Ensure the cryptocurrency is listed on the Korean exchanges for accurate comparison.
- Data Accuracy: Volumes are compared in the same base currency (e.g., BTC), so no exchange rate conversion is necessary.
Enhance your trading analysis by understanding the influence of Korean exchanges on cryptocurrency volumes with the Korean Exchange Volume Comparison indicator.
Script de código abierto
Fiel al espíritu de TradingView, el creador de este script lo ha convertido en código abierto, para que los traders puedan revisar y verificar su funcionalidad. ¡Enhorabuena al autor! Aunque puede utilizarlo de forma gratuita, recuerde que la republicación del código está sujeta a nuestras Normas internas.
Exención de responsabilidad
La información y las publicaciones no constituyen, ni deben considerarse como asesoramiento o recomendaciones financieras, de inversión, de trading o de otro tipo proporcionadas o respaldadas por TradingView. Más información en Condiciones de uso.