OPEN-SOURCE SCRIPT
Actualizado TTM Squeeze Pro - Intraday
TTM Squeeze Pro – Intraday (AI MTF Edition)
Design Rationale
This indicator is built to help traders identify when markets are consolidating, when volatility is building (squeeze), and when a breakout or trend is starting — all across multiple timeframes.
The design combines three powerful ideas:
Volatility Compression & Expansion (TTM Squeeze Logic):
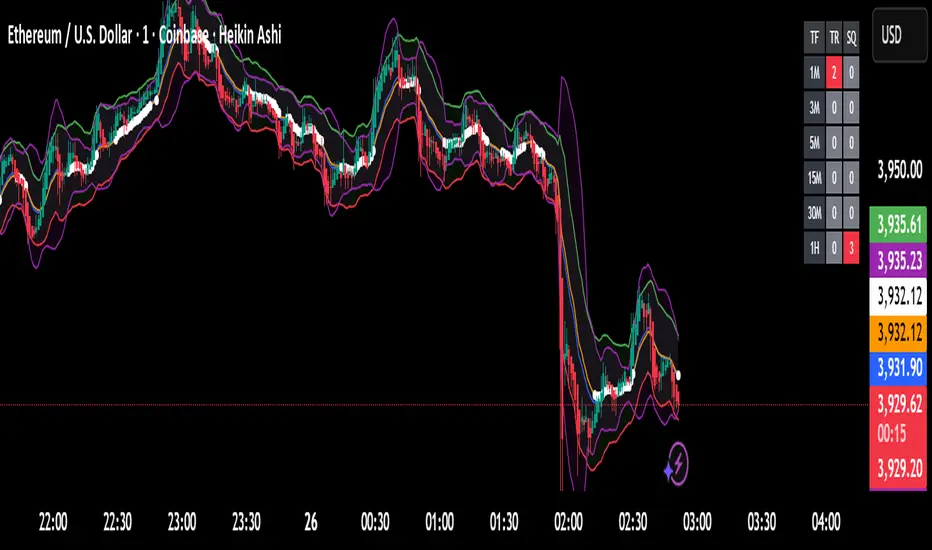
By comparing Bollinger Bands (BB) and Keltner Channels (KC), the indicator detects when volatility contracts (BB inside KC). These moments often precede explosive moves. White dots on the BB basis line mark these “squeeze” periods.
Trend Strength & Direction (ADX System):
The ADX (Average Directional Index) measures how strong a trend is.
ADX rising above the threshold → trending market.
ADX falling below the threshold → consolidation.
The system classifies each bar as Trending Up, Trending Down, Consolidating, or Neutral, depending on ADX and momentum direction.
Multi-Timeframe (MTF) Alignment:
The same logic is applied to several timeframes (1m, 3m, 5m, 15m, 30m, 1h).
A compact table at the top-right shows each timeframe’s trend and squeeze strength.
This helps traders see whether short-term and higher timeframes are aligned, improving trade confidence and timing.
The AI Enhancer automatically adjusts all parameters (ADX, BB, KC lengths, and thresholds) depending on the current chart timeframe, keeping signals consistent between scalping and swing trading setups.
Trend and squeeze strengths are normalized on a 1–9 scale, giving users a quick numerical sense of trend power and squeeze intensity. The design emphasizes clarity, speed, and adaptability — critical for intraday trading decisions.
How to Use
Identify a Squeeze Setup:
Look for white dots on the chart — this marks low volatility and potential energy buildup.
Wait for Breakout Confirmation:
When the white dots disappear, volatility expands.
Check the MTF table — if multiple timeframes show green (uptrend) or red (downtrend) in the “TR” column, momentum is aligning.
Enter the Trade:
Go long if breakout happens above BB basis and most timeframes show green.
Go short if breakout happens below BB basis and most timeframes show red.
Exit or Manage Position:
When new white dots appear → volatility contracting again → consider exiting or tightening stops.
If MTF colors become mixed → trend losing strength.
In Summary
The TTM Squeeze Pro – Intraday AI MTF Indicator blends volatility analysis, trend strength, momentum, and multi-timeframe alignment into one adaptive tool.
Its design aims to simplify complex market behavior into a visual, data-backed format — enabling traders to catch high-probability breakout trends early and avoid false moves during low-volatility phases.
Design Rationale
This indicator is built to help traders identify when markets are consolidating, when volatility is building (squeeze), and when a breakout or trend is starting — all across multiple timeframes.
The design combines three powerful ideas:
Volatility Compression & Expansion (TTM Squeeze Logic):
By comparing Bollinger Bands (BB) and Keltner Channels (KC), the indicator detects when volatility contracts (BB inside KC). These moments often precede explosive moves. White dots on the BB basis line mark these “squeeze” periods.
Trend Strength & Direction (ADX System):
The ADX (Average Directional Index) measures how strong a trend is.
ADX rising above the threshold → trending market.
ADX falling below the threshold → consolidation.
The system classifies each bar as Trending Up, Trending Down, Consolidating, or Neutral, depending on ADX and momentum direction.
Multi-Timeframe (MTF) Alignment:
The same logic is applied to several timeframes (1m, 3m, 5m, 15m, 30m, 1h).
A compact table at the top-right shows each timeframe’s trend and squeeze strength.
This helps traders see whether short-term and higher timeframes are aligned, improving trade confidence and timing.
The AI Enhancer automatically adjusts all parameters (ADX, BB, KC lengths, and thresholds) depending on the current chart timeframe, keeping signals consistent between scalping and swing trading setups.
Trend and squeeze strengths are normalized on a 1–9 scale, giving users a quick numerical sense of trend power and squeeze intensity. The design emphasizes clarity, speed, and adaptability — critical for intraday trading decisions.
How to Use
Identify a Squeeze Setup:
Look for white dots on the chart — this marks low volatility and potential energy buildup.
Wait for Breakout Confirmation:
When the white dots disappear, volatility expands.
Check the MTF table — if multiple timeframes show green (uptrend) or red (downtrend) in the “TR” column, momentum is aligning.
Enter the Trade:
Go long if breakout happens above BB basis and most timeframes show green.
Go short if breakout happens below BB basis and most timeframes show red.
Exit or Manage Position:
When new white dots appear → volatility contracting again → consider exiting or tightening stops.
If MTF colors become mixed → trend losing strength.
In Summary
The TTM Squeeze Pro – Intraday AI MTF Indicator blends volatility analysis, trend strength, momentum, and multi-timeframe alignment into one adaptive tool.
Its design aims to simplify complex market behavior into a visual, data-backed format — enabling traders to catch high-probability breakout trends early and avoid false moves during low-volatility phases.
Notas de prensa
Just a small name updateScript de código abierto
Fiel al espíritu de TradingView, el creador de este script lo ha convertido en código abierto, para que los traders puedan revisar y verificar su funcionalidad. ¡Enhorabuena al autor! Aunque puede utilizarlo de forma gratuita, recuerde que la republicación del código está sujeta a nuestras Normas internas.
Exención de responsabilidad
La información y las publicaciones no constituyen, ni deben considerarse como asesoramiento o recomendaciones financieras, de inversión, de trading o de otro tipo proporcionadas o respaldadas por TradingView. Más información en Condiciones de uso.
Script de código abierto
Fiel al espíritu de TradingView, el creador de este script lo ha convertido en código abierto, para que los traders puedan revisar y verificar su funcionalidad. ¡Enhorabuena al autor! Aunque puede utilizarlo de forma gratuita, recuerde que la republicación del código está sujeta a nuestras Normas internas.
Exención de responsabilidad
La información y las publicaciones no constituyen, ni deben considerarse como asesoramiento o recomendaciones financieras, de inversión, de trading o de otro tipo proporcionadas o respaldadas por TradingView. Más información en Condiciones de uso.