PROTECTED SOURCE SCRIPT
Qullamaggie High Tight Flag Table
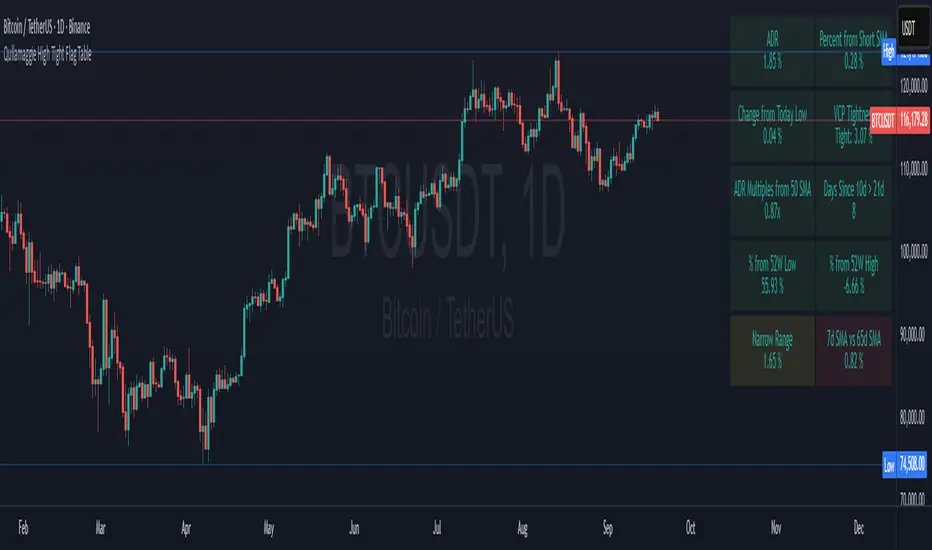
This indicator is a breakout scanner inspired by Qullamaggie's high-tight flag momentum strategy and Stockbee's Momentum Burst setups. It displays a 2x5 table of key technical metrics to identify high-probability long breakout opportunities in trending stocks or crypto on daily charts. The table highlights setups where a stock consolidates tightly after a strong uptrend, signaling potential volatility expansion for sharp upside moves. Green boxes indicate bullish conditions, while alerts notify traders of optimal setups or risks.
Table Box Descriptions
The table is divided into two columns: the left focuses on volatility and range, the right on trend and relative strength. Each cell shows a metric’s value with conditional coloring—green for bullish alignment, red for bearish/unmet conditions, yellow/orange for neutral/warning zones, and consistent transparency (90%) for readability. Below are the updated box descriptions:
ADR (Left, Row 1): Average Daily Range (%) over a user-selectable lookback (5/10/15/20 days, default 20), calculated relative to the previous low, close, or current close (user-selectable). Always green for visibility, with higher values (e.g., ≥6%) indicating volatility suited for breakouts.
Change from Today Low (Left, Row 2): Percentage gain from the current day’s low to close. Green if ≥0% (intraday strength), red if negative (weakness). Signals if the stock is holding support without excessive downside.
ADR Multiples from 50 SMA (Left, Row 3): Price deviation from the 50-day SMA in ADR units (e.g., 6% move above SMA with 1% ADR = 6x). Green (<6x, healthy trend), yellow (6-9x, extended), red (9-14x, overextended), purple (>14x, extreme caution). Identifies coiled setups or overextension risks.
% from 52W Low (Left, Row 4): Percentage distance from the 52-week low. Green if ≥30% (strong recovery from bases), red otherwise. Filters for stocks with significant momentum from yearly lows.
Narrow Range (Left, Row 5): Average daily range (%) over 3-5 days (user-selectable), compared to ADR, with checks for today’s change from low < ADR and volume ≤70% of 20-day average. Optional: limits to one 4%+ drop. Green if range < ADR and volume low (tight consolidation), yellow if range < ADR but volume high, red otherwise. Signals coiling before a breakout.
Percent from Short SMA (Right, Row 1): Percentage deviation from the 10-day SMA. Green if ≥0% (price at/above short-term trend), red if below. Ensures alignment with immediate uptrend support.
VCP Tightness (Right, Row 2): 5-day high-low range as a percentage of the lowest low, with a breakout check (≥12% gain in prior 5-10 days). Shows "Tight: X.XX%" or "N/A". Green if <10% (tight contraction), red otherwise. Captures high-tight flag volatility squeezes.
Days Since 10d > 21d (Right, Row 3): Days since the 10-day SMA crossed above the 21-day SMA. Red if NA or downtrend (10d ≤ 21d), green if ≤10 days (fresh uptrend), yellow if 11-30 days (maturing), orange if >30 days (aging). Tracks trend freshness for timely entries.
% from 52W High (Right, Row 4): Percentage distance from the 52-week high. Green if ≥-25% (near highs), yellow if -25% to -30% (warning zone), red if <-30% (far from highs). Gauges proximity to breakout resistance.
7d SMA vs 65d SMA (Right, Row 5): Percentage difference between 7-day and 65-day SMAs. Green if ≥5% (short-term outpacing long-term), red otherwise. Confirms broader trend acceleration.
Key Features
Ideal Setup: Look for green boxes in Days Since 10d > 21d (≤10), VCP Tightness (<10%), and % from Short SMA (±3%) during a narrow range consolidation near support, signaling a high-probability breakout.
Alerts:
Qullamaggie Breakout Alert: Triggers when ADR ≥6%, Days Since 10d > 21d ≤10, 10d SMA > 21d SMA, VCP Tightness <10%, and price within ±3% of 10d SMA. Signals a high-tight flag breakout setup.
High Tight Flag Good Setup: Triggers when all non-ADR boxes (9 metrics) are green, yellow, or orange (no red or purple). Indicates a strong setup for long entry.
Overextension Warning: Triggers when ADR Multiples from 50 SMA ≥9x (red or purple), warning of pullback risk.
SMA Plots: 10-day (white) and 21-day (green) SMAs, toggleable in settings (off by default).
Customizable: Adjust table position (top/middle/bottom, left/center/right), text/background colors, ADR lookback, narrow range period (3-5 days), and enforce a single 4%+ drop limit.
Usage
Apply to daily charts (e.g., SOLUSDT, AAPL, TSLA) with 100+ bars.
Seek mostly green boxes, especially in Days Since 10d > 21d, VCP Tightness, and % from Short SMA, with rising volume for confirmation.
Use alerts to catch breakouts, strong setups, or overextensions in real-time.
Enable SMA plots to visualize trends if needed.
Handles edge cases (short history, crypto precision) for robust performance.
Note: Not financial advice—combine with your risk management, chart patterns, and market context.
Script protegido
Este script se publica como código cerrado. No obstante, puede utilizarlo libremente y sin ninguna limitación. Obtenga más información aquí.
Exención de responsabilidad
La información y las publicaciones no constituyen, ni deben considerarse como asesoramiento o recomendaciones financieras, de inversión, de trading o de otro tipo proporcionadas o respaldadas por TradingView. Más información en Condiciones de uso.