OPEN-SOURCE SCRIPT
Stoch + RSI Oscillator @shrilss
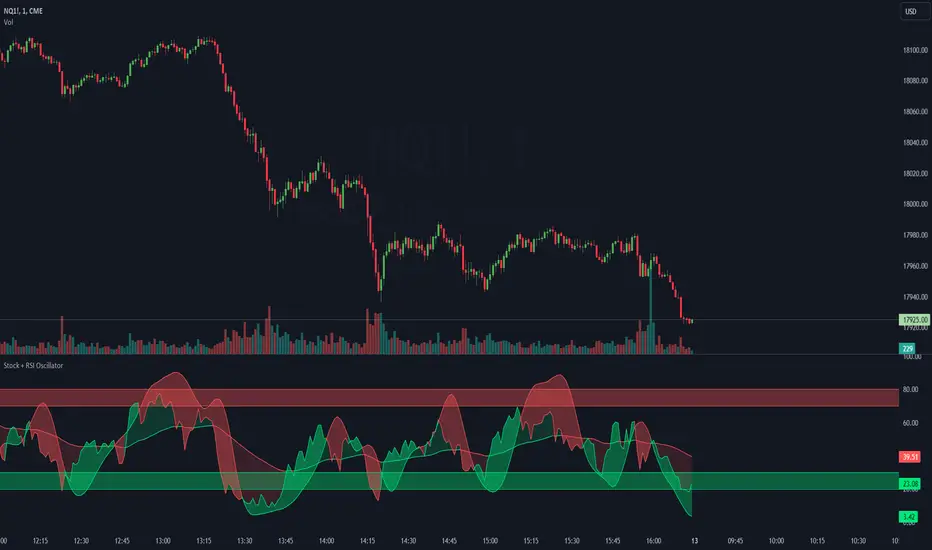
This script combines two powerful indicators, the Stochastic Oscillator and the Relative Strength Index (RSI), to offer traders a comprehensive view of market dynamics.
The Stochastic Oscillator, known for its effectiveness in identifying overbought and oversold conditions, is enhanced here with a smoothing mechanism to provide clearer signals. The script calculates the %K and %D lines of the Stochastic Oscillator, then applies a smoothing factor to %K, resulting in a smoother representation of price momentum.
Simultaneously, the RSI component offers insights into the strength of price movements. By comparing the average gains and losses over a specified period, it provides a measure of bullish and bearish sentiment within the market.
This script's innovation lies in its integration of these two indicators. The Stochastic Oscillator's smoothed %K line and the RSI are compared to dynamic thresholds, enabling traders to identify potential trend reversals and confirmations more effectively. When the RSI crosses above or below the Stochastic %D line, it can signal potential shifts in market momentum.
Script de código abierto
Fiel al espíritu de TradingView, el creador de este script lo ha convertido en código abierto, para que los traders puedan revisar y verificar su funcionalidad. ¡Enhorabuena al autor! Aunque puede utilizarlo de forma gratuita, recuerde que la republicación del código está sujeta a nuestras Normas internas.
Exención de responsabilidad
La información y las publicaciones no pretenden ser, ni constituyen, asesoramiento o recomendaciones financieras, de inversión, de trading o de otro tipo proporcionadas o respaldadas por TradingView. Más información en Condiciones de uso.