CVD Line + EMA
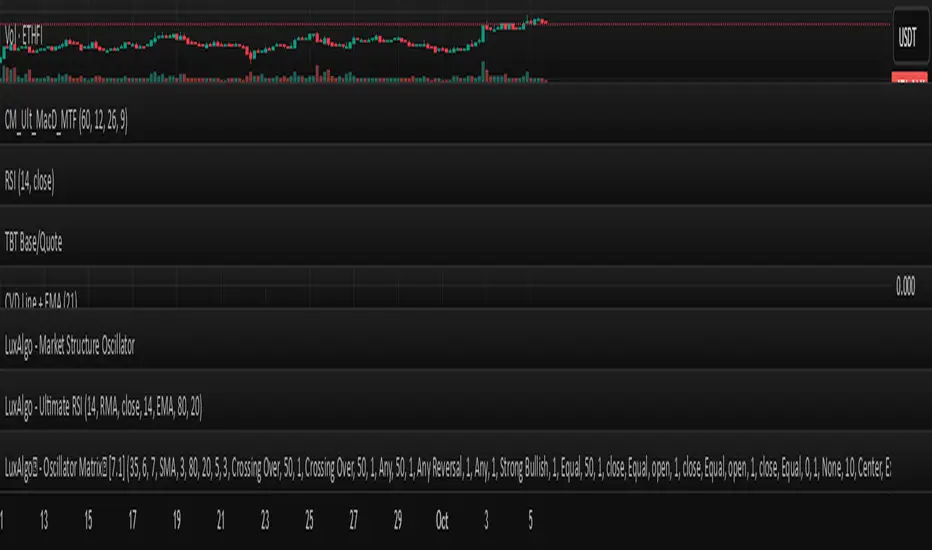
Settings allow users to customize the EMA period to suit different timeframes or trading strategies. The script is intended for educational purposes and is released under the Mozilla Public License 2.0. For best results, use in conjunction with other analysis and risk management tools.
Script que requiere invitación
Solo los usuarios autorizados por el autor pueden acceder a este script. Tendrá que solicitar y obtener permiso para utilizarlo. Normalmente se concede previo pago. Para obtener más información, siga las instrucciones del autor o póngase en contacto directamente con MFH_BM.
TradingView NO recomienda pagar o utilizar un script a menos que confíe plenamente en su autor y entienda cómo funciona. También puede encontrar alternativas gratuitas de código abierto en nuestros scripts de la comunidad.
Instrucciones del autor
Exención de responsabilidad
Script que requiere invitación
Solo los usuarios autorizados por el autor pueden acceder a este script. Tendrá que solicitar y obtener permiso para utilizarlo. Normalmente se concede previo pago. Para obtener más información, siga las instrucciones del autor o póngase en contacto directamente con MFH_BM.
TradingView NO recomienda pagar o utilizar un script a menos que confíe plenamente en su autor y entienda cómo funciona. También puede encontrar alternativas gratuitas de código abierto en nuestros scripts de la comunidad.