OPEN-SOURCE SCRIPT
Actualizado MTF Trend Truth [Hubka]
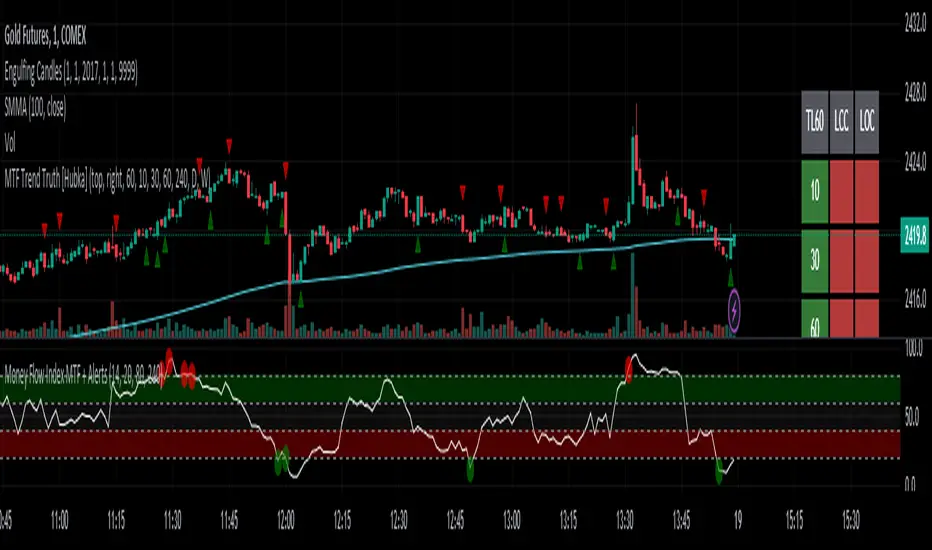
A Multi Time Frame Tend table that displays symbols trends for 6 selectable Time Intervals. In addition to the 6 first row color trends, the table also displays the direction of the last 2 candles in each Time Interval in the last 2 rows. This extra interval information displays price trend direction change or may add confluence if the price direction is the same.
The top row of the table has column header names described below:
(TL30) Column 1 - Trend Interval + The Trend Length selected (30 is default). Uses the last 30 candles to determine the trend for this interval. The length number is Editable.
(LCC) Column 2 - Last Closed Candle. This is the direction color of the second last candle on the chart.
(LOC) Column 3 - Last Open Candle. The is the current candle color direction of the last candle on the chart. This candle has not yet closed and will flicker as price changing state.
NOTE 1: (LOC) Column 3 - Last Open Candle - only displays correctly when the market is open and price is changing.
You can adjust the "Trend Length in Candles" which defaults to using the trend of the last 30 candles (TL30). Edit this setting to use any number from 5 to 99 candles back if you want display different trend lengths.
Having a visual table of the price trends from different time intervals can be beneficial to traders. For example... When observing that a symbol has many Bullish (green) price trends on several time intervals and the last 2 candles are also bullish it should afford a trader confluence to trade in that same bullish direction. However I am not a professional and do not offer any trading advice in any way. Use this indicator at your own risk.
NOTE 2: Time interval of 240 = 4 hours. Below 1 day number only is minutes.
Notas de prensa
UPD: Change color transparency so table views better with white chart background.Change default trendLength default value from 30 to 60
Script de código abierto
Fiel al espíritu de TradingView, el creador de este script lo ha convertido en código abierto, para que los traders puedan revisar y verificar su funcionalidad. ¡Enhorabuena al autor! Aunque puede utilizarlo de forma gratuita, recuerde que la republicación del código está sujeta a nuestras Normas internas.
Exención de responsabilidad
La información y las publicaciones no constituyen, ni deben considerarse como asesoramiento o recomendaciones financieras, de inversión, de trading o de otro tipo proporcionadas o respaldadas por TradingView. Más información en Condiciones de uso.