PROTECTED SOURCE SCRIPT
Awesome Oscillator (AO) - Two EMA / SMA
Awesome Oscillator with EMA indicator plots Awesome Oscillator indicator (Bill M. Williams) on Two Exponential Moving Averages.
The value of the Awesome Oscillator indicator is calculated as the difference between moving averages over these two time frames.
Rather than using closing prices, though, these moving averages use the midpoints of the bars (i.e. halfway between the high and the low).
Midpoint = (H + L)/2
AO = Fast Moving Average - Slow Moving Average
The indicator subtracts the Fast Moving Average from the Slow Moving Average and plots this value as a histogram.
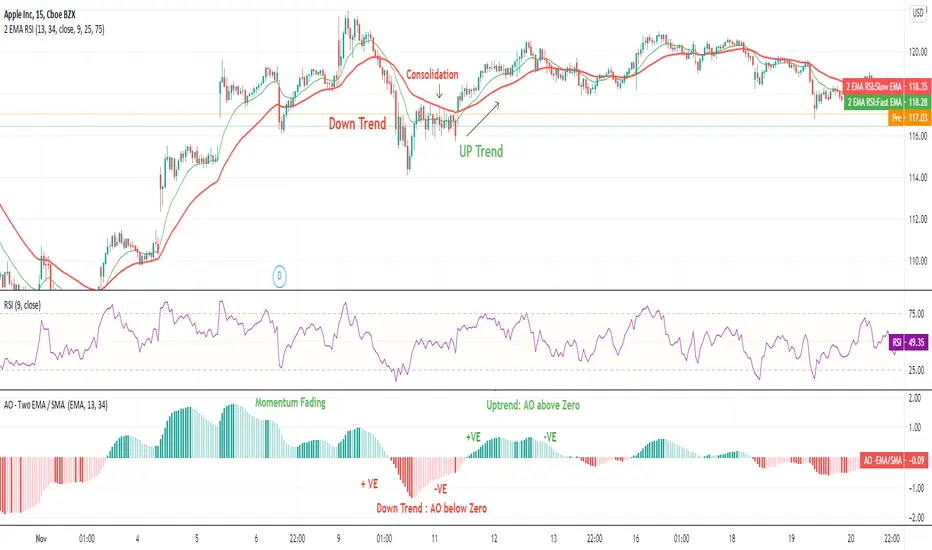
It measures the market momentum with the aim to detect potential trend direction or trend reversals and momentum.
How to read the Indicator ?
The value of the Awesome Oscillator indicator is calculated as the difference between moving averages over these two time frames.
Rather than using closing prices, though, these moving averages use the midpoints of the bars (i.e. halfway between the high and the low).
Midpoint = (H + L)/2
AO = Fast Moving Average - Slow Moving Average
The indicator subtracts the Fast Moving Average from the Slow Moving Average and plots this value as a histogram.
It measures the market momentum with the aim to detect potential trend direction or trend reversals and momentum.
How to read the Indicator ?
- When AO is greater than zero line, it is an uptrend. When AO is less than zero it is a downtrend.Rising AO indicates momentum intact. Falling AO indicates momentum loosing the steam.When AO is nearing zero, one can expect the trend reversal & big move in opposite direction in trending market.
Script protegido
Este script se publica como código cerrado. No obstante, puede utilizarlo libremente y sin ninguna limitación. Obtenga más información aquí.
Exención de responsabilidad
La información y las publicaciones no constituyen, ni deben considerarse como asesoramiento o recomendaciones financieras, de inversión, de trading o de otro tipo proporcionadas o respaldadas por TradingView. Más información en Condiciones de uso.