OPEN-SOURCE SCRIPT
VixFix RVol + EMA
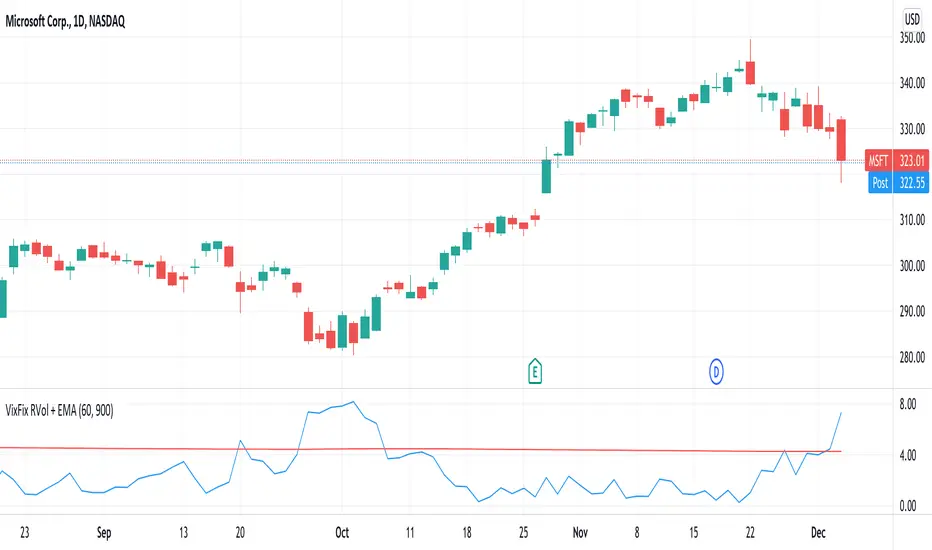
This indicator plots Realised Volatility (measured using VixFix method) against its long-term exponential moving average.
RVol breaking above its EMA = Sell signal
RVol breaking below its EMA = Buy signal
60-day VixFix look back period and 900 day EMA work well for lower volatility tickers (equity ETFs, megacap stocks). Higher volatility tickers could benefit from shorter look back period and EMA.
RVol breaking above its EMA = Sell signal
RVol breaking below its EMA = Buy signal
60-day VixFix look back period and 900 day EMA work well for lower volatility tickers (equity ETFs, megacap stocks). Higher volatility tickers could benefit from shorter look back period and EMA.
Script de código abierto
Fiel al espíritu de TradingView, el creador de este script lo ha convertido en código abierto, para que los traders puedan revisar y verificar su funcionalidad. ¡Enhorabuena al autor! Aunque puede utilizarlo de forma gratuita, recuerde que la republicación del código está sujeta a nuestras Normas internas.
Exención de responsabilidad
La información y las publicaciones no constituyen, ni deben considerarse como asesoramiento o recomendaciones financieras, de inversión, de trading o de otro tipo proporcionadas o respaldadas por TradingView. Más información en Condiciones de uso.