OPEN-SOURCE SCRIPT
Money Flow | Lyro RS
Money Flow | Lyro RS
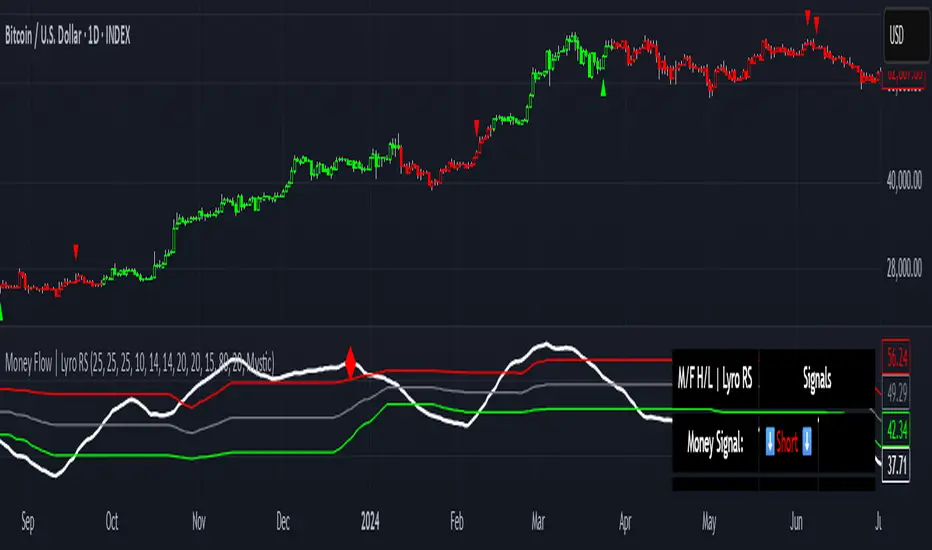
The Money Flow is a momentum and volume-driven oscillator designed to highlight market strength, exhaustion, and potential reversal points. By combining smoothed Money Flow Index readings with volatility, momentum, and RVI-based logic, it offers traders a deeper perspective on money inflow/outflow, divergences, and overbought/oversold dynamics.
Key Features
Smoothed Money Flow Line
EMA-smoothed calculation of the MFI for noise reduction.
Clear thresholds for overbought and oversold zones.
Normalized Histogram
Histogram plots show bullish/bearish money flow pressure.
Color-coded cross logic for quick trend assessment.
Relative Volatility Index (RVI) Signals
Detects overbought and oversold conditions using volatility-adjusted RVI.
Plots ▲ and ▼ markers at exhaustion points.
Momentum Strength Gauge
Calculates normalized momentum strength from ROC and volume activity.
Displays percentage scale of current momentum force.
Divergence Detection
Bullish divergence: Price makes lower lows while money flow makes higher lows.
Bearish divergence: Price makes higher highs while money flow makes lower highs.
Plotted as diamond markers on the oscillator.
Signal Dashboard (Table Overlay)
Displays real-time status of Money Flow signals, volatility, and momentum.
Color-coded readouts for instant clarity (Long/Short/Neutral + Momentum Bias).
How It Works
Money Flow Calculation – Applies EMA smoothing to MFI values.
Normalization – Scales oscillator between relative high/low values.
Trend & Signals – Generates bullish/bearish signals based on midline and histogram cross logic.
RVI Integration – Confirms momentum exhaustion with overbought/oversold markers.
Divergences – Identifies hidden market imbalances between price and money flow.
Practical Use
Trend Confirmation – Use midline crossovers with histogram direction for money flow bias.
Overbought/Oversold Reversals – Watch RVI ▲/▼ markers for exhaustion setups.
Momentum Tracking – Monitor momentum percentage to gauge strength of current trend.
Divergence Alerts – Spot early reversal opportunities when money flow diverges from price action.
Customization
Adjust length, smoothing, and thresholds for different markets.
Enable/disable divergence detection as needed.
Personalize visuals and dashboard display for cleaner charts.
⚠️ Disclaimer
This indicator is a tool for technical analysis and does not provide guaranteed results. It should be used alongside other methods and proper risk management. The creator is not responsible for financial decisions made using this script.
Script de código abierto
Fiel al espíritu de TradingView, el creador de este script lo ha convertido en código abierto, para que los traders puedan revisar y verificar su funcionalidad. ¡Enhorabuena al autor! Aunque puede utilizarlo de forma gratuita, recuerde que la republicación del código está sujeta a nuestras Normas internas.
Get access to our private indicators: whop.com/lyro-rs
Join our community: discord.gg/kcEBMWaFjS
All material from Lyro RS is for educational purposes only. Past performance does not guarantee future results.
Join our community: discord.gg/kcEBMWaFjS
All material from Lyro RS is for educational purposes only. Past performance does not guarantee future results.
Exención de responsabilidad
La información y las publicaciones no constituyen, ni deben considerarse como asesoramiento o recomendaciones financieras, de inversión, de trading o de otro tipo proporcionadas o respaldadas por TradingView. Más información en Condiciones de uso.