PROTECTED SOURCE SCRIPT
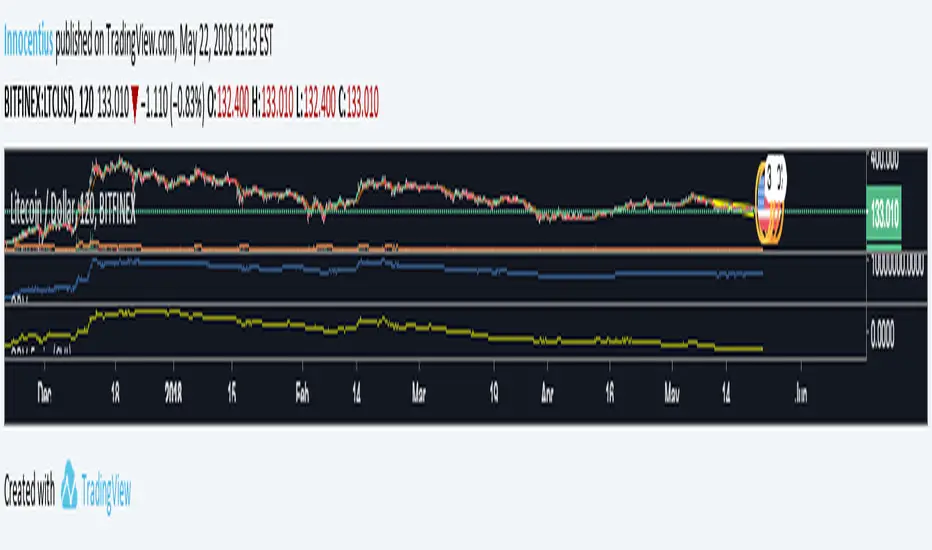
On Balance Volume locked 5min (CVI)

OBV shows the cumulation of the volume bars. All the volume in a green bar gets added to the obv and all the volume in a red bar gets subtracted. At a higher timeframe this can be misleading, because it filters out a lot of volume. This indicator locks the obv at 5 minutes, giving more information about the total amount of added and subtracted volume.
Script protegido
Este script se publica como código cerrado. No obstante, puede utilizarlo libremente y sin ninguna limitación. Obtenga más información aquí.
Exención de responsabilidad
La información y las publicaciones no constituyen, ni deben considerarse como asesoramiento o recomendaciones financieras, de inversión, de trading o de otro tipo proporcionadas o respaldadas por TradingView. Más información en Condiciones de uso.