OPEN-SOURCE SCRIPT
Number of Bars CheatSheet
A regular trading day on the New York Stock Exchange (NYSE) consists of two main sessions: the Opening Auction and the Closing Auction, separated by a continuous trading session. Here's a breakdown of the trading day:
1. **Pre-Opening Session**: This session starts at 4:00 AM Eastern Time (ET) and lasts until 9:30 AM ET. During this time, there is limited trading activity, and orders can be entered and canceled. However, most of the trading activity doesn't occur until the regular trading session begins.
2. **Regular Trading Session**: The regular trading session on the NYSE starts at 9:30 AM ET and lasts until 4:00 PM ET. This is the primary trading session where the majority of price bars are formed.
3. **Closing Auction**: After the regular trading session ends at 4:00 PM ET, there is a closing auction period that typically lasts until 4:10 PM ET. During this time, there is a final price discovery process where orders are matched to determine the closing price for each security.
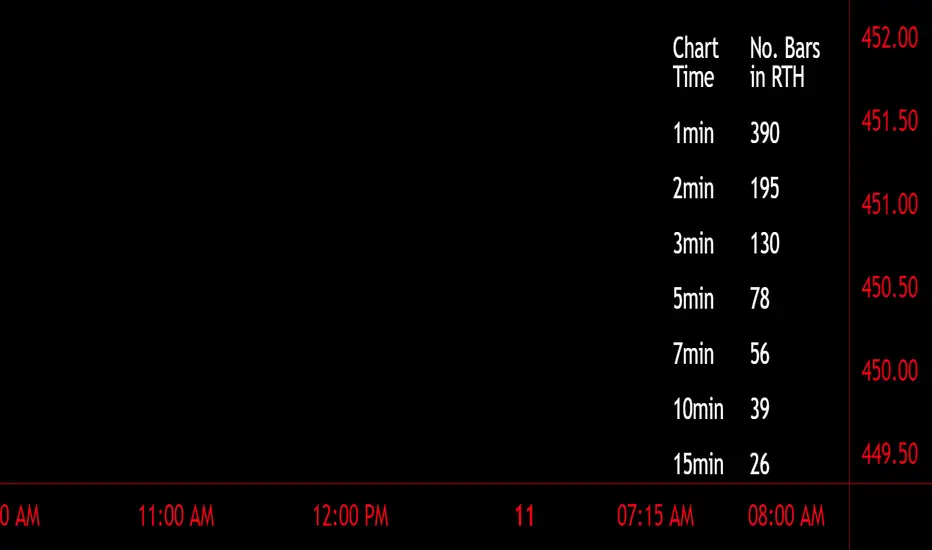
So, during the regular trading session, which is the main focus for most traders and investors, there are a total of 6.5 hours of trading. Trading occurs continuously during this time, with price bars being formed based on the time frame you're looking at. The most common time frames for price bars are one minute, five minutes, 15 minutes, 30 minutes, and one hour, among others. Therefore, the number of price bars in a regular trading day on the NYSE will depend on the time frame you are using for your analysis. For example, if you are using one-minute bars, there will be 6.5 x 60 = 390 price bars in a regular trading day.
1. **Pre-Opening Session**: This session starts at 4:00 AM Eastern Time (ET) and lasts until 9:30 AM ET. During this time, there is limited trading activity, and orders can be entered and canceled. However, most of the trading activity doesn't occur until the regular trading session begins.
2. **Regular Trading Session**: The regular trading session on the NYSE starts at 9:30 AM ET and lasts until 4:00 PM ET. This is the primary trading session where the majority of price bars are formed.
3. **Closing Auction**: After the regular trading session ends at 4:00 PM ET, there is a closing auction period that typically lasts until 4:10 PM ET. During this time, there is a final price discovery process where orders are matched to determine the closing price for each security.
So, during the regular trading session, which is the main focus for most traders and investors, there are a total of 6.5 hours of trading. Trading occurs continuously during this time, with price bars being formed based on the time frame you're looking at. The most common time frames for price bars are one minute, five minutes, 15 minutes, 30 minutes, and one hour, among others. Therefore, the number of price bars in a regular trading day on the NYSE will depend on the time frame you are using for your analysis. For example, if you are using one-minute bars, there will be 6.5 x 60 = 390 price bars in a regular trading day.
Script de código abierto
Fiel al espíritu de TradingView, el creador de este script lo ha convertido en código abierto, para que los traders puedan revisar y verificar su funcionalidad. ¡Enhorabuena al autor! Aunque puede utilizarlo de forma gratuita, recuerde que la republicación del código está sujeta a nuestras Normas internas.
Exención de responsabilidad
La información y las publicaciones no constituyen, ni deben considerarse como asesoramiento o recomendaciones financieras, de inversión, de trading o de otro tipo proporcionadas o respaldadas por TradingView. Más información en Condiciones de uso.