OPEN-SOURCE SCRIPT
Cryptogenik's Inflation-Adjusted Candles v2025
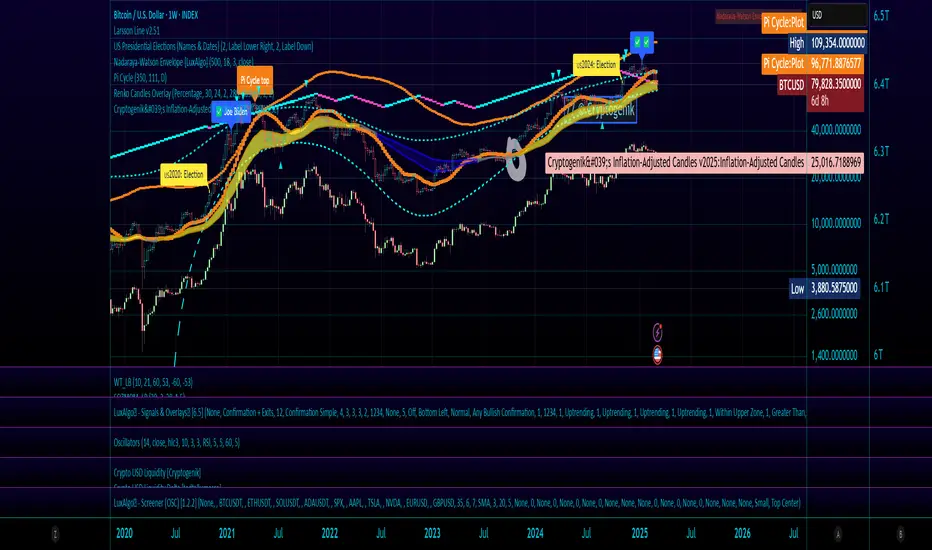
Inflation-Adjusted Price Indicator by Cryptogenik
This indicator adjusts price data for inflation, allowing you to visualize how stock/asset prices would look with constant purchasing power. By using Consumer Price Index (CPI) data from FRED, it transforms nominal prices into inflation-adjusted values that reflect real-world purchasing power.
What This Indicator Does
The Inflation-Adjusted Price indicator converts traditional price charts to show what prices would be if the purchasing power of currency remained constant. This is essential for long-term analysis, as it removes the distortion caused by inflation when comparing prices across different time periods.
Key Features
How To Use It
This indicator is particularly valuable for analyzing stocks, commodities, and other assets over periods of 5+ years, where inflation effects become significant. It helps answer the question: "Has this asset truly increased in value, or is the price increase just reflecting inflation?"
Technical Details
The indicator calculates adjusted prices using the formula: (price / CPI) * 100, which effectively shows prices as a percentage of current purchasing power. This approach normalizes all prices to a consistent standard, making historical comparisons more meaningful.
Cryptogenik's Inflation-Adjusted Candles v2025
This indicator adjusts price data for inflation, allowing you to visualize how stock/asset prices would look with constant purchasing power. By using Consumer Price Index (CPI) data from FRED, it transforms nominal prices into inflation-adjusted values that reflect real-world purchasing power.
What This Indicator Does
The Inflation-Adjusted Price indicator converts traditional price charts to show what prices would be if the purchasing power of currency remained constant. This is essential for long-term analysis, as it removes the distortion caused by inflation when comparing prices across different time periods.
Key Features
- Displays inflation-adjusted price candles alongside original prices
- Uses official CPI data from the Federal Reserve (FRED:CPIAUCSL)
- Allows easy comparison between nominal and real prices
- Helps identify true price movements by filtering out the effects of inflation
- Perfect for long-term investors and macroeconomic analysis
How To Use It
- Apply the indicator to any chart
- Green/red candles show the inflation-adjusted prices
- Gray line shows the original unadjusted price
- The information label displays the current CPI value
This indicator is particularly valuable for analyzing stocks, commodities, and other assets over periods of 5+ years, where inflation effects become significant. It helps answer the question: "Has this asset truly increased in value, or is the price increase just reflecting inflation?"
Technical Details
The indicator calculates adjusted prices using the formula: (price / CPI) * 100, which effectively shows prices as a percentage of current purchasing power. This approach normalizes all prices to a consistent standard, making historical comparisons more meaningful.
Cryptogenik's Inflation-Adjusted Candles v2025
Script de código abierto
Fiel al espíritu de TradingView, el creador de este script lo ha convertido en código abierto, para que los traders puedan revisar y verificar su funcionalidad. ¡Enhorabuena al autor! Aunque puede utilizarlo de forma gratuita, recuerde que la republicación del código está sujeta a nuestras Normas internas.
Exención de responsabilidad
La información y las publicaciones no constituyen, ni deben considerarse como asesoramiento o recomendaciones financieras, de inversión, de trading o de otro tipo proporcionadas o respaldadas por TradingView. Más información en Condiciones de uso.