OPEN-SOURCE SCRIPT
Actualizado ADX Divergence Indicator
Description:
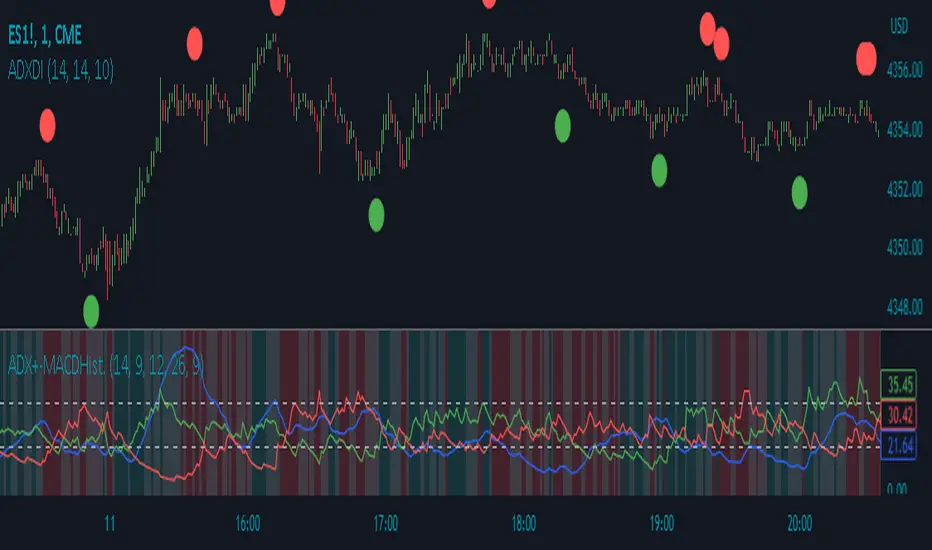
The ADX Divergence Indicator (ADXDI) is a technical analysis tool designed to identify potential bullish and bearish signals based on the Average Directional Index (ADX), the Positive Directional Indicator (+DI), and the Negative Directional Indicator (-DI) lines. This overlay indicator plots circles on the chart to highlight these signals.
How it Works:
The ADXDI calculates the ADX, +DI, and -DI values using user-defined parameters. It then evaluates specific conditions to determine potential bullish and bearish signals. The indicator considers rising and falling trends of the +DI and -DI lines, as well as changes in the ADX values. Additionally, it detects a bounce condition when the current ADX is less than the previous ADX value and that ADX value is higher than the one previous to it.
Usage:
To effectively utilize the ADX Divergence Indicator, follow these steps:
1. Apply the ADX Divergence Indicator to your chart by adding it from the available indicators.
2. Observe the circles plotted on the chart:
- Bullish circles (green by default) indicate potential bullish signals.
- Bearish circles (red by default) indicate potential bearish signals.
4. Interpret the signals provided by the indicator:
- A bullish signal occurs when the +DI line rises and the -DI line falls.
- A bearish signal occurs when the -DI line rises and the +DI line falls.
- The presence of a bounce condition (ADX < ADX and ADX > ADX) further strengthens the signal.
5. Combine the signals from the ADX Signals indicator with other technical analysis tools, such as support and resistance levels, trend lines, or candlestick patterns, to confirm potential trade setups.
6. Customize the indicator's parameters, such as the lengths of the DI and ADX calculations or the colors of the plotted circles, to suit your trading preferences.
7. Implement appropriate risk management strategies, including setting stop-loss orders and position sizing, to manage your trades effectively and protect your capital.
Notas de prensa
A 9 period EMA has been added to filter out false signals.Notas de prensa
The ADX Divergence Indicator detects a bounce condition and plots a signal when a divergence has happened within 3 bars of the bounce. This was making it possible for both a bullish and a bearish signal to be plotted simultaneously. The code has been updated to cancel out signals that overlap.Notas de prensa
Two Updates:- A threshold input has been included to allow the user to have the option of using a minimum ADX value for a signal to be plotted.
- A 21 period EMA has been added to be used in conjunction with the 9 period EMA to further reduce false signals.
Notas de prensa
Alerts have been added to the script.Notas de prensa
Alerts happen only when a candle closes with a signal. The alert will happen at the beginning of the following candle.Notas de prensa
Indicator shapes and locations are now customizable.Notas de prensa
In the Indicator Settings:1. The "Create Alerts" option has been moved to the top of the "Inputs" tab
2. Color, Shape, and Location options are all moved to the "Style" tab
Notas de prensa
The chart image has been updated to show my private ADX+- with MACD Histogram indicator. Access to this indicator is granted to everyone who follows me.Script de código abierto
Fiel al espíritu de TradingView, el creador de este script lo ha convertido en código abierto, para que los traders puedan revisar y verificar su funcionalidad. ¡Enhorabuena al autor! Aunque puede utilizarlo de forma gratuita, recuerde que la republicación del código está sujeta a nuestras Normas internas.
Exención de responsabilidad
La información y las publicaciones no constituyen, ni deben considerarse como asesoramiento o recomendaciones financieras, de inversión, de trading o de otro tipo proporcionadas o respaldadas por TradingView. Más información en Condiciones de uso.
Script de código abierto
Fiel al espíritu de TradingView, el creador de este script lo ha convertido en código abierto, para que los traders puedan revisar y verificar su funcionalidad. ¡Enhorabuena al autor! Aunque puede utilizarlo de forma gratuita, recuerde que la republicación del código está sujeta a nuestras Normas internas.
Exención de responsabilidad
La información y las publicaciones no constituyen, ni deben considerarse como asesoramiento o recomendaciones financieras, de inversión, de trading o de otro tipo proporcionadas o respaldadas por TradingView. Más información en Condiciones de uso.